
The Best-Paying American Cities for Carpenters
Note: This is the most recent release of our Best-Paying American Cities for Carpenters study. To see data from prior years, please visit the Full Results section below.
The construction and real estate industries continue to undergo significant shifts moving into 2026. The residential sector experienced rapid growth during the COVID-19 pandemic—driven by low interest rates and high demand for suburban housing. However, new home construction has since declined from its 2022 peak. Meanwhile, public construction spending, which had seen steady growth due to federal investments through the Infrastructure Investment and Jobs Act (IIJA) and the Inflation Reduction Act, appears to be leveling off, signaling a potential industry-wide slowdown.
For carpenters and other skilled tradespeople, these shifting conditions are reshaping job opportunities and earnings potential across the country. Against this backdrop, this report from Construction Coverage analyzes the most recent data from the U.S. Bureau of Labor Statistics and the U.S. Bureau of Economic Analysis to assess how carpenters are faring economically. The analysis focuses on projected job growth within the occupation, how carpenter wages compare to those of other skilled trade workers, and which U.S. cities offer the highest and lowest pay after adjusting for cost of living differences.
Key Takeaways
- Job prospects remain strong despite headwinds. The BLS projects total carpenter employment to grow 4.5% in the coming decade, ahead of the 3.1% average across all occupations.
- Carpenter wages outpace the broader construction sector. The median annual wage for carpenters is $59,310, which is about $1,000 more than what’s typical for the construction industry overall.
- Low wages in the South. Real wages for carpenters are consistently low in the South, even after adjusting for lower living costs. Carpenters in Hawaii and Illinois can make about $30,000 more per year than those in Florida and Texas.
Carpenter Jobs to Grow 4.5% by 2034
BLS projects carpenter job growth will beat the national average (+3.1%) but trail the broader construction sector (+5.2%)
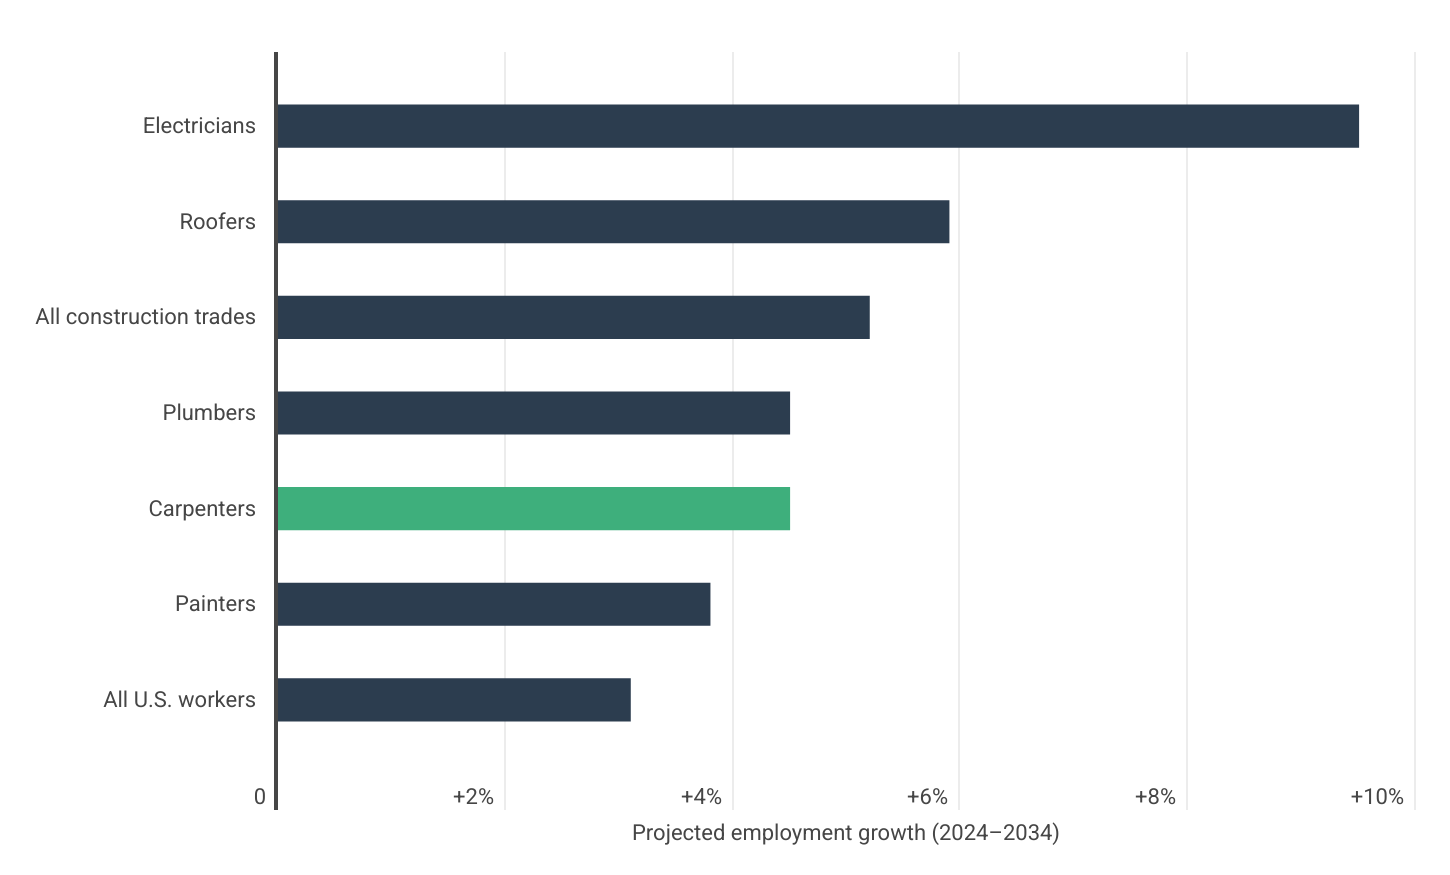
Data: 10-Year Projected Employment Growth for Carpenters Compared to Other Occupations
| Occupation | Projected Employment Growth (2024–2034) |
|---|---|
| Electricians | +9.5% |
| Roofers | +5.9% |
| All Construction Trades | +5.2% |
| Plumbers | +4.5% |
| Carpenters | +4.5% |
| Painters | +3.8% |
| All U.S. Workers | +3.1% |
While overall job growth in the U.S. is projected to remain modest over the next decade, the demand for skilled tradespeople continues to outpace the national average. According to projections from the U.S. Bureau of Labor Statistics, employment for carpenters is expected to grow by 4.5% between 2024 and 2034—surpassing the 3.1% growth rate forecasted for all U.S. workers.
However, this growth trails the broader construction trades category, which is projected to grow by 5.2%. Electricians (+9.5%) and roofers (+5.9%) are expected to see especially strong job gains, due in part to the ongoing investment in electrification and residential solar installations. Plumbers, whose employment is projected to grow at the same rate as carpenters (+4.5%), tend to see more stable demand because their work often involves essential and routine maintenance services.
Carpenters, by contrast, are more vulnerable to economic slowdowns. Their work is closely tied to new construction and remodeling activity—segments that are often delayed or scaled back during periods of rising interest rates or broader economic uncertainty. While the long-term outlook remains positive, carpenter employment tends to be more cyclical and sensitive to shifts in the housing market.
Independent carpenters rely on a mix of coverages—not a single policy
Our handyman insurance guide explains the liability, property, and equipment protections that small carpentry businesses typically carry to meet client requirements and safeguard their income.
How Much Do U.S. Carpenters Make Per Year?
Carpenters earn a median $59,310 per year ($28.51 per hour), which is 20% more than the typical U.S. worker
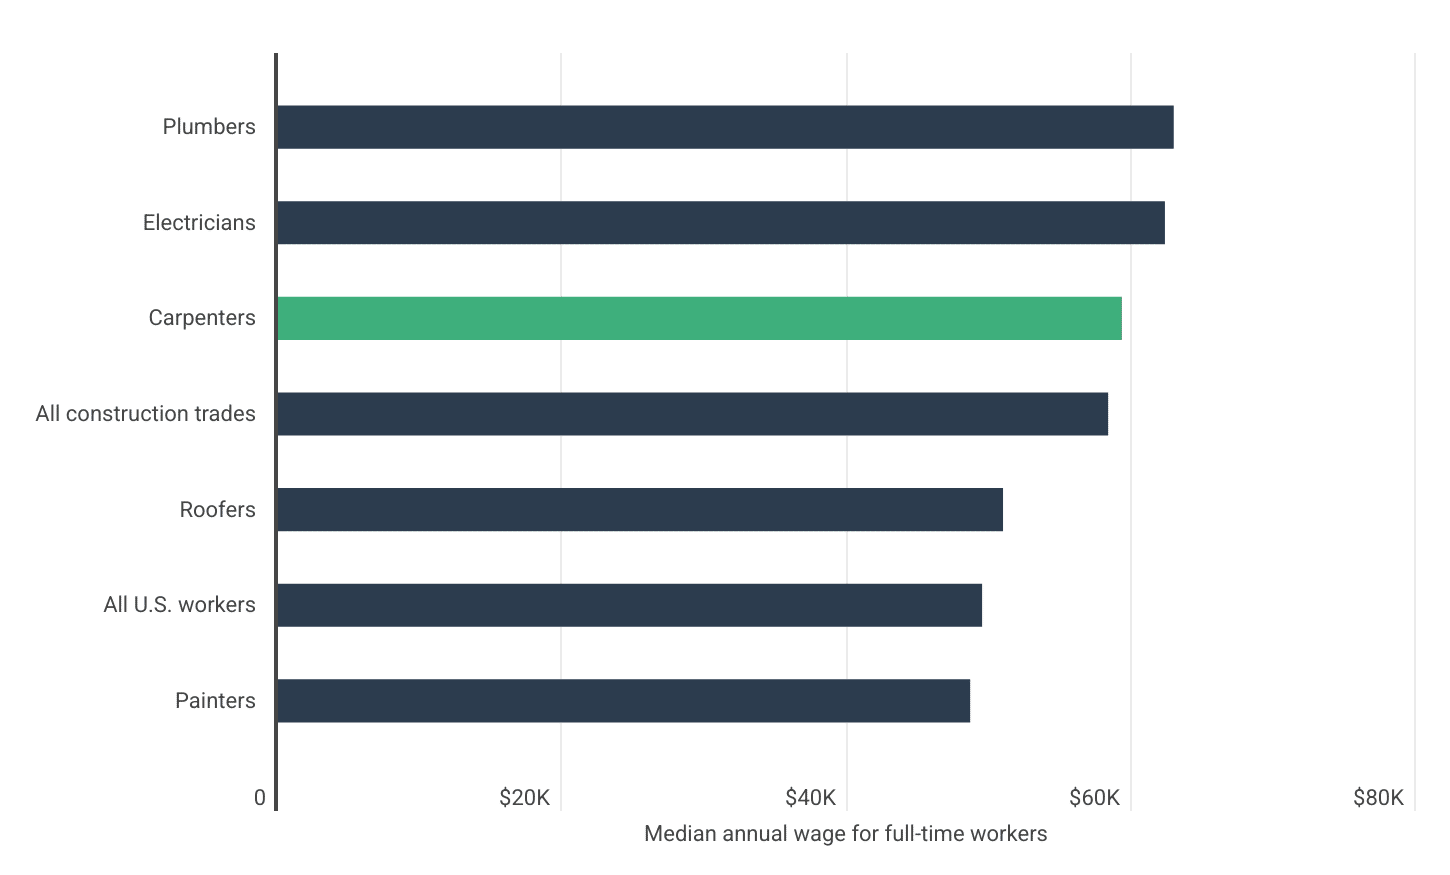
Data: Carpenter Pay Compared to Other Occupations
| Occupation | Median Annual Wage for Full-Time Workers |
|---|---|
| Plumbers | $62,970 |
| Electricians | $62,350 |
| Carpenters | $59,310 |
| All Construction Trades | $58,360 |
| Roofers | $50,970 |
| All U.S. Workers | $49,500 |
| Painters | $48,660 |
Carpenters in the United States earn a median annual wage of $59,310, or $28.51 per hour, according to the most recent figures from the U.S. Bureau of Labor Statistics. This places carpenter earnings roughly 20% above the national median for all full-time workers, which stands at $49,500.
Within the construction trades, carpenter wages fall in the middle of the pack. Plumbers and electricians lead with median annual wages of $62,970 and $62,350, respectively. Carpenters earn slightly more than the median wage for all construction workers ($58,360), as well as more than roofers ($50,970) and painters ($48,660).
These wage patterns reflect both the skill level required and the type of work performed in each trade. Trades like plumbing and electrical work often require more specialized training and certification, which can contribute to higher pay. Nonetheless, carpentry remains a relatively well-compensated trade compared to other jobs, especially given that the positions do not require a four-year college degree.
Carpenters rely on gear that’s costly to replace
Tools and equipment insurance covers losses from theft or damage to saws, drills, and other essential gear—protecting your ability to stay productive on the job.
How Carpenter Salaries Vary by State
Adjusted for cost of living, carpenter wages range from a high of $79,156 in Hawaii to a low of $46,476 in Florida
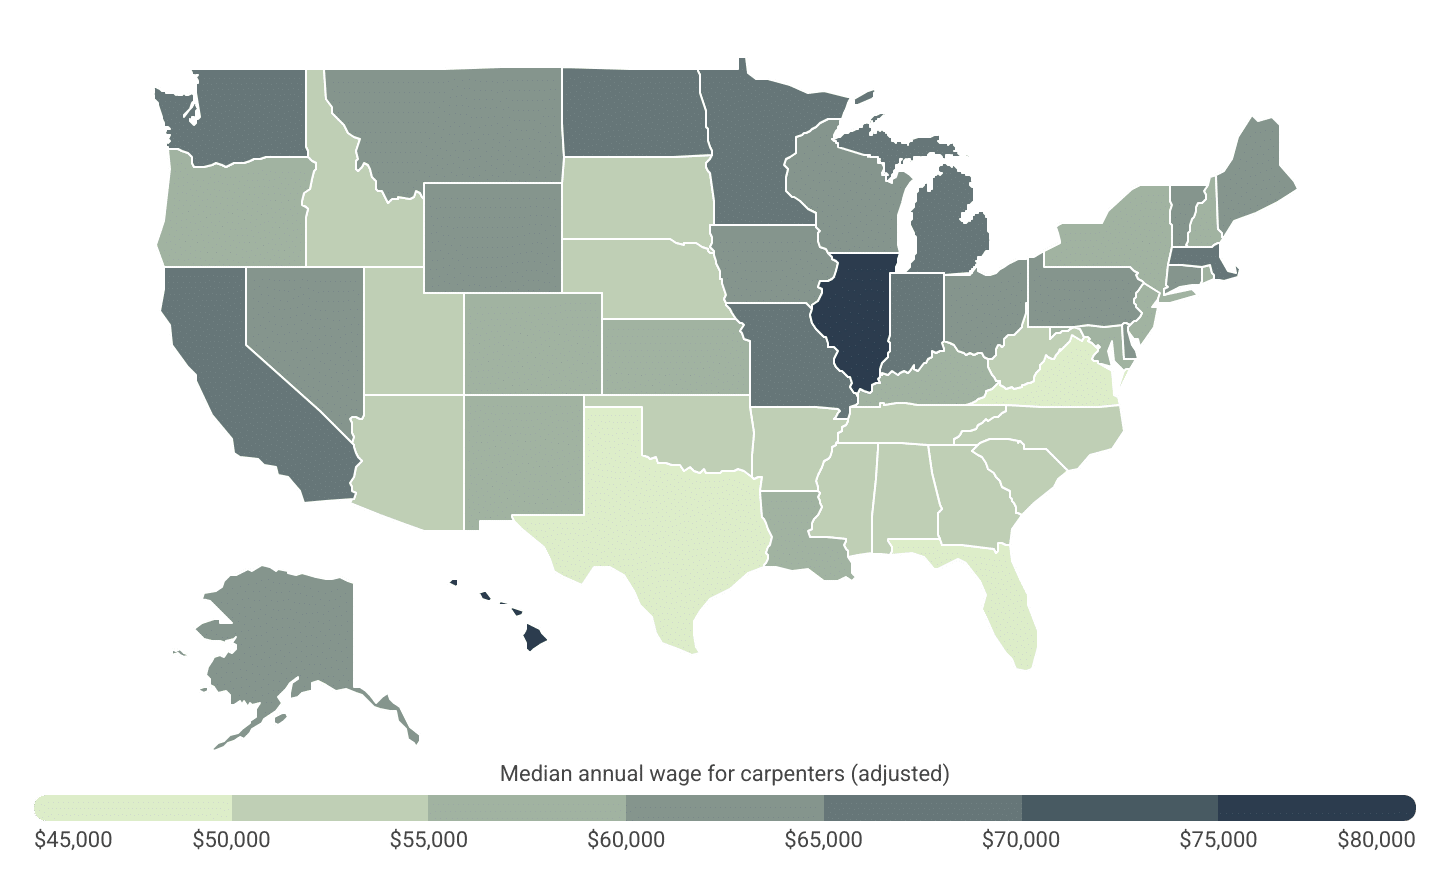
Data: Regional Differences in Median Carpenter Salary
| State | Median Annual Wage for Carpenters (Adjusted) |
|---|---|
| Hawaii | $79,156 |
| Illinois | $77,295 |
| Washington | $67,482 |
| Missouri | $66,640 |
| California | $66,459 |
| North Dakota | $65,924 |
| Massachusetts | $65,698 |
| Minnesota | $65,690 |
| Indiana | $65,640 |
| Michigan | $65,202 |
| Wisconsin | $64,868 |
| Montana | $64,392 |
| Vermont | $64,387 |
| Nevada | $64,178 |
| Alaska | $64,052 |
| Ohio | $63,510 |
| Delaware | $61,560 |
| Wyoming | $61,498 |
| Connecticut | $61,250 |
| Maine | $60,960 |
| Iowa | $60,924 |
| Pennsylvania | $60,759 |
| Rhode Island | $59,667 |
| New York | $59,149 |
| Colorado | $58,679 |
| Oregon | $58,412 |
| Maryland | $57,837 |
| New Mexico | $57,542 |
| Kansas | $57,300 |
| New Hampshire | $56,851 |
| New Jersey | $56,832 |
| Kentucky | $56,219 |
| Louisiana | $56,211 |
| Nebraska | $54,871 |
| Utah | $54,441 |
| Oklahoma | $54,074 |
| Arizona | $53,944 |
| Arkansas | $53,544 |
| Tennessee | $53,526 |
| Alabama | $53,218 |
| Idaho | $53,082 |
| Mississippi | $52,880 |
| South Dakota | $52,784 |
| West Virginia | $52,711 |
| South Carolina | $52,491 |
| Georgia | $52,255 |
| North Carolina | $50,595 |
| Virginia | $49,847 |
| Texas | $49,550 |
| Florida | $46,476 |
Carpenters already earn competitive wages relative to other occupations requiring similar education levels, but pay varies widely depending on where they work. Regional economic conditions, labor market policies, union strength, and cost of living all play a role in determining how far a carpenter’s paycheck goes.
Hawaii offers the highest adjusted median annual wage for carpenters at $79,156—making it one of only two states where adjusted carpenter wages exceed $70,000. This figure is 33% higher than the national median and nearly $2,000 above the next highest state. Hawaii’s top ranking is supported by the state’s high union membership rate—the highest in the country—as well as strong minimum wage laws.
Following Hawaii are Illinois ($77,295), Washington ($67,482), Missouri ($66,640), and California ($66,459). Many of these states—particularly in the Midwest and on the West Coast—also have robust labor protections, higher minimum wages, and greater union representation, all of which contribute to stronger wage outcomes for carpenters. States like North Dakota, Minnesota, and Michigan also rank highly, reflecting the Midwest’s relatively strong affordability for skilled tradeworkers.
At the other end of the spectrum, states in the Southeast generally offer the lowest cost-of-living-adjusted pay for carpenters. Florida ranks last at $46,476, followed closely by Texas ($49,550), Virginia ($49,847), and North Carolina ($50,595). These lower rankings reflect a combination of lower prevailing wages, weaker union presence, and more limited labor protections in these regions.
Unsurprisingly, at the metro level, several locations in the Midwest and on the West Coast are also among the best-paying for carpenters. Among major metropolitan areas with populations of one million or more, Chicago, Minneapolis, and Sacramento rank as the top three best-paying cities for carpenters.
Busy carpenters juggle multiple projects at once
Construction scheduling software helps track timelines, coordinate with other trades, and keep small crews organized—reducing downtime between jobs.
Below is a breakdown of carpenter wages for nearly 370 U.S. metropolitan areas and all 50 states. The analysis was conducted by Construction Coverage, using data from the U.S. Bureau of Labor Statistics. For more information, see the methodology section below.
Best & Worst-Paying Cities for Carpenters
| Top Large Metros | Wage* |
|---|---|
| 1. Chicago-Naperville-Elgin, IL-IN | $74,602 |
| 2. Minneapolis-St. Paul-Bloomington, MN-WI | $72,444 |
| 3. Sacramento-Roseville-Folsom, CA | $70,807 |
| 4. San Jose-Sunnyvale-Santa Clara, CA | $69,188 |
| 5. San Francisco-Oakland-Fremont, CA | $68,471 |
| 6. Seattle-Tacoma-Bellevue, WA | $67,935 |
| 7. St. Louis, MO-IL | $67,582 |
| 8. Detroit-Warren-Dearborn, MI | $66,383 |
| 9. Boston-Cambridge-Newton, MA-NH | $66,144 |
| 10. San Diego-Chula Vista-Carlsbad, CA | $66,095 |
| 11. Kansas City, MO-KS | $65,447 |
| 12. Indianapolis-Carmel-Greenwood, IN | $65,417 |
| 13. Milwaukee-Waukesha, WI | $65,169 |
| 14. Columbus, OH | $65,058 |
| 15. Los Angeles-Long Beach-Anaheim, CA | $63,956 |
| Bottom Large Metros | Wage* |
|---|---|
| 1. Miami-Fort Lauderdale-West Palm Beach, FL | $43,282 |
| 2. Dallas-Fort Worth-Arlington, TX | $46,876 |
| 3. Tampa-St. Petersburg-Clearwater, FL | $47,538 |
| 4. Jacksonville, FL | $48,490 |
| 5. Houston-Pasadena-The Woodlands, TX | $48,803 |
| 6. Orlando-Kissimmee-Sanford, FL | $48,838 |
| 7. Virginia Beach-Chesapeake-Norfolk, VA-NC | $50,339 |
| 8. Raleigh-Cary, NC | $50,536 |
| 9. Tucson, AZ | $50,580 |
| 10. Richmond, VA | $50,639 |
| 11. San Antonio-New Braunfels, TX | $50,860 |
| 12. Austin-Round Rock-San Marcos, TX | $50,860 |
| 13. Atlanta-Sandy Springs-Roswell, GA | $50,915 |
| 14. Charlotte-Concord-Gastonia, NC-SC | $52,393 |
| 15. Oklahoma City, OK | $53,595 |
| Top Midsize Metros | Wage* |
|---|---|
| 1. Peoria, IL | $87,997 |
| 2. Urban Honolulu, HI | $85,346 |
| 3. Vallejo, CA | $73,773 |
| 4. Santa Rosa-Petaluma, CA | $73,771 |
| 5. Toledo, OH | $69,172 |
| 6. Lansing-East Lansing, MI | $67,854 |
| 7. Flint, MI | $67,447 |
| 8. Ann Arbor, MI | $66,409 |
| 9. New Haven, CT | $66,298 |
| 10. Salinas, CA | $65,733 |
| 11. Bakersfield-Delano, CA | $65,488 |
| 12. Madison, WI | $65,239 |
| 13. Davenport-Moline-Rock Island, IA-IL | $65,204 |
| 14. Augusta-Richmond County, GA-SC | $64,968 |
| 15. Fort Wayne, IN | $64,948 |
| Bottom Midsize Metros | Wage* |
|---|---|
| 1. Brownsville-Harlingen, TX | $43,154 |
| 2. Lubbock, TX | $43,942 |
| 3. El Paso, TX | $44,093 |
| 4. Naples-Marco Island, FL | $46,167 |
| 5. Cape Coral-Fort Myers, FL | $46,419 |
| 6. Port St. Lucie, FL | $46,472 |
| 7. Hickory-Lenoir-Morganton, NC | $46,626 |
| 8. North Port-Bradenton-Sarasota, FL | $46,741 |
| 9. Ocala, FL | $46,782 |
| 10. Deltona-Daytona Beach-Ormond Beach, FL | $46,930 |
| 11. Lakeland-Winter Haven, FL | $47,025 |
| 12. Palm Bay-Melbourne-Titusville, FL | $47,135 |
| 13. McAllen-Edinburg-Mission, TX | $47,303 |
| 14. Gainesville, FL | $47,908 |
| 15. Tallahassee, FL | $48,027 |
| Top Small Metros | Wage* |
|---|---|
| 1. Decatur, IL | $93,264 |
| 2. Oshkosh-Neenah, WI | $91,254 |
| 3. Janesville-Beloit, WI | $89,033 |
| 4. Fairbanks-College, AK | $83,654 |
| 5. Rockford, IL | $82,905 |
| 6. Springfield, IL | $80,056 |
| 7. Bloomington, IL | $79,857 |
| 8. Kahului-Wailuku, HI | $77,418 |
| 9. Kankakee, IL | $76,137 |
| 10. Hanford-Corcoran, CA | $73,688 |
| 11. Columbus, IN | $73,124 |
| 12. Kennewick-Richland, WA | $72,827 |
| 13. Cape Girardeau, MO-IL | $71,938 |
| 14. Champaign-Urbana, IL | $71,863 |
| 15. El Centro, CA | $71,743 |
| Bottom Small Metros | Wage* |
|---|---|
| 1. Abilene, TX | $40,590 |
| 2. Wichita Falls, TX | $42,344 |
| 3. Burlington, NC | $43,063 |
| 4. Dothan, AL | $44,306 |
| 5. Valdosta, GA | $44,930 |
| 6. Fort Smith, AR-OK | $45,355 |
| 7. Sebring, FL | $46,901 |
| 8. Gadsden, AL | $46,909 |
| 9. Rocky Mount, NC | $46,976 |
| 10. San Angelo, TX | $47,541 |
| 11. Hammond, LA | $47,697 |
| 12. Daphne-Fairhope-Foley, AL | $47,780 |
| 13. Homosassa Springs, FL | $47,793 |
| 14. Punta Gorda, FL | $48,163 |
| 15. Panama City-Panama City Beach, FL | $48,163 |
Best & Worst-Paying States for Carpenters
| Top States | Wage* |
|---|---|
| 1. Hawaii | $79,156 |
| 2. Illinois | $77,295 |
| 3. Washington | $67,482 |
| 4. Missouri | $66,640 |
| 5. California | $66,459 |
| 6. North Dakota | $65,924 |
| 7. Massachusetts | $65,698 |
| 8. Minnesota | $65,690 |
| 9. Indiana | $65,640 |
| 10. Michigan | $65,202 |
| 11. Wisconsin | $64,868 |
| 12. Montana | $64,392 |
| 13. Vermont | $64,387 |
| 14. Nevada | $64,178 |
| 15. Alaska | $64,052 |
| Bottom States | Wage* |
|---|---|
| 1. Florida | $46,476 |
| 2. Texas | $49,550 |
| 3. Virginia | $49,847 |
| 4. North Carolina | $50,595 |
| 5. Georgia | $52,255 |
| 6. South Carolina | $52,491 |
| 7. West Virginia | $52,711 |
| 8. South Dakota | $52,784 |
| 9. Mississippi | $52,880 |
| 10. Idaho | $53,082 |
| 11. Alabama | $53,218 |
| 12. Tennessee | $53,526 |
| 13. Arkansas | $53,544 |
| 14. Arizona | $53,944 |
| 15. Oklahoma | $54,074 |
*Median annual wage for carpenters (adjusted)
Full Results: Carpenter Wages by City & State
Methodology
The data used in this analysis is from the U.S. Bureau of Labor Statistics’ 2024 Occupational Employment and Wage Statistics and the U.S. Bureau of Economic Analysis’ 2023 Regional Price Parities dataset. To determine the best-paying locations for carpenters, researchers calculated the median annual earnings for carpenters, adjusted for cost-of-living differences. To improve relevance, metropolitan areas were grouped into cohorts based on population size: small (less than 350,000), midsize (350,000–999,999), and large (1,000,000 or more).
References
- U.S. Bureau of Labor Statistics (2025). Occupational Outlook Handbook. https://www.bls.gov/ooh/construction-and-extraction/carpenters.htm.
- U.S. Department of Labor (2025). State Minimum Wage Laws. https://www.dol.gov/agencies/whd/minimum-wage/state.
- U.S. Bureau of Labor Statistics (2024). Occupational Employment and Wage Statistics. https://www.bls.gov/oes/.
- U.S. Bureau of Economic Analysis (2023). Regional Price Parities. https://www.bea.gov/data/prices-inflation/regional-price-parities-state-and-metro-area.