
The Best-Paying U.S. Cities for Electricians
Note: This is the most recent release of our Best-Paying U.S. Cities for Electricians study. To see data from previous years, please visit the Full Results section below.
Electricians are becoming increasingly important to the U.S. economy as electricity demand accelerates and the country expands its energy infrastructure.
Electricians can enter the field without four-year degrees and can instead opt for a less expensive trade school education or an apprenticeship that allows them to earn while they hone their skills. Demand for electricians’ services is already strong, but the field also has bright prospects given recent technology and policy shifts.
The U.S. is experiencing a rapid surge in electricity demand, driven in large part by the explosive growth of artificial intelligence, cloud computing, and energy-intensive data centers. This increase in consumption is placing new strain on an aging power grid that was not built for such high and fluctuating loads. To keep up, utilities and governments are racing to modernize grid infrastructure and integrate more renewable energy sources like solar and wind. These sweeping changes—both in the technologies we use and how we power them—are expected to significantly expand the need for skilled electricians to install, maintain, and upgrade electrical systems across the country.
However, as the nation increasingly embraces electrification, a crucial challenge has emerged: the existing workforce of electricians may not be sufficient to meet the rising demand.
Projected Job Growth for Electricians: A Leader Among the Trades
The BLS projects that electrician jobs will grow 3X faster than the U.S. average

Data: 10-Year Projected Employment Growth for Electricians Compared to Other Occupations
| Occupation | Projected Employment Growth (2024–2034) |
|---|---|
| Electricians | +9.5% |
| Roofers | +5.9% |
| All Construction Trades | +5.2% |
| Plumbers | +4.5% |
| Carpenters | +4.5% |
| Painters | +3.8% |
| All U.S. Workers | +3.1% |
According to the Bureau of Labor Statistics, job opportunities for electricians are projected to grow at a pace that’s three times faster than the national average in the coming decade. Electrician employment is expected to rise by 9.5% from 2024 to 2034, far exceeding the 3.1% growth rate projected for all U.S. jobs.
Electricians are also set to outpace their peers in related construction trades. While the overall construction trades sector is anticipated to grow by 5.2% by 2034, roofers are projected to see slightly higher gains of 5.9%, while carpenters (+4.5%), plumbers (+4.5%), and painters (+3.8%) are expected to experience slower growth. Despite muted projections for some of these popular construction occupations, they are still above the national average for all U.S. workers, an indication of the continued demand for skilled trades workers.
Electrical work carries unique business risks
Electricians routinely work in environments where a small mistake can trigger costly damage or liability. Many jurisdictions and commercial clients require active coverage before permitting electrical work. Our electrician insurance guide breaks down the policies most electricians rely on to stay compliant and protected.
How Much Do Electricians Make Per Year?
Electricians earn a median $62,350 per year, or $30 per hour, which is 26% more than the typical American worker
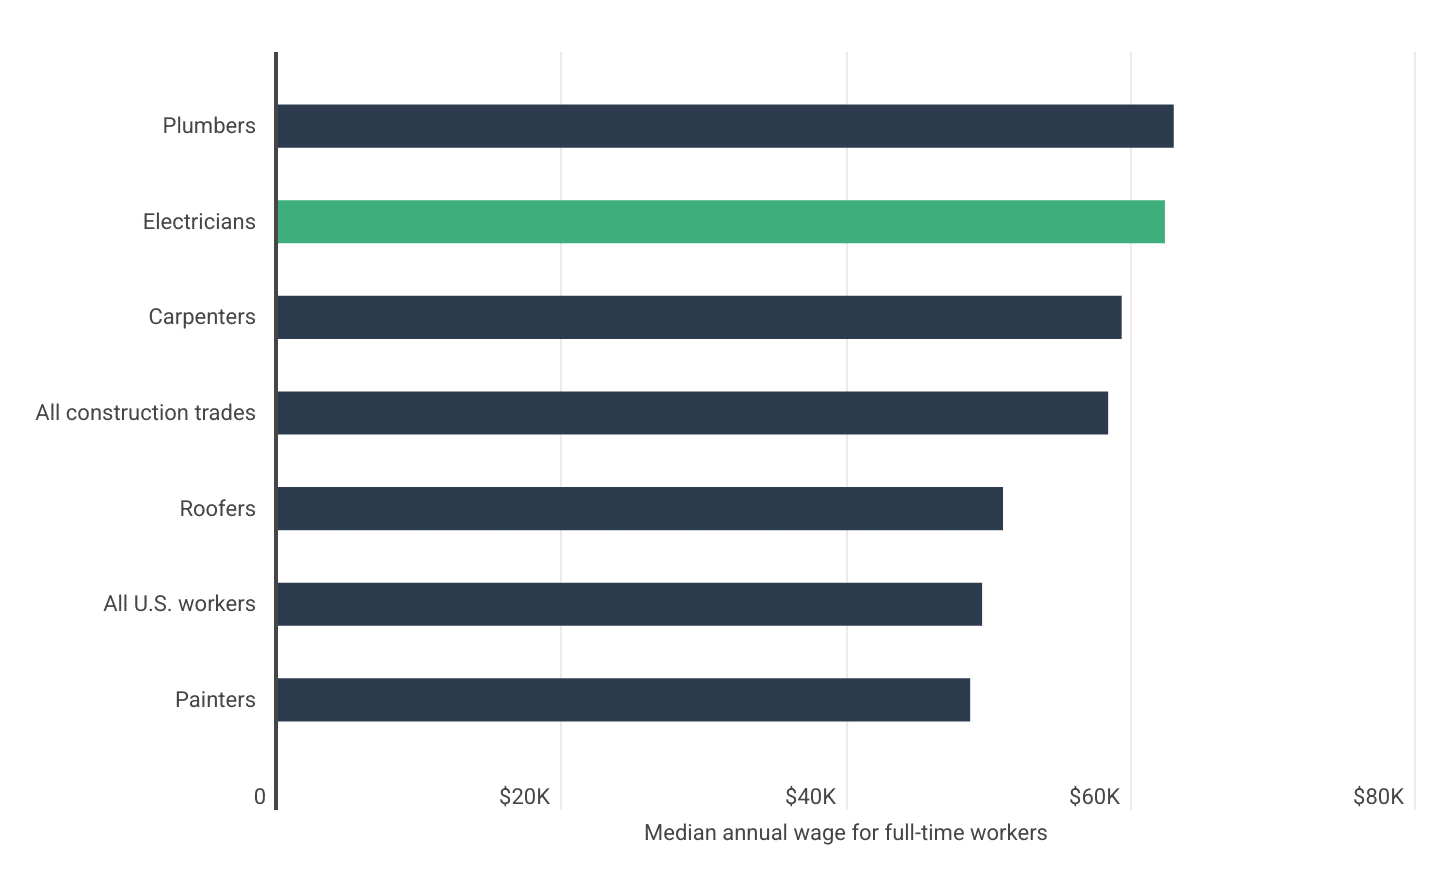
Data: Electrician Pay Compared to Other Occupations
| Occupation | Median Annual Wage for Full-Time Workers |
|---|---|
| Plumbers | $62,970 |
| Electricians | $62,350 |
| Carpenters | $59,310 |
| All Construction Trades | $58,360 |
| Roofers | $50,970 |
| All U.S. Workers | $49,500 |
| Painters | $48,660 |
In large part due to strong demand, electricians are well compensated compared to other skilled trade workers and to those with similar levels of required training. In 2024, the median annual wage for electricians was $62,350, approximately 26% higher than the median wage of $49,500 across all U.S. occupations.
Even within the skilled trades, electricians stand out for their pay. On average, electricians earn about 6.8% more than the broader group of construction trades workers. While plumbers have a similar median salary as electricians, other trades such as roofers and painters earn significantly less, with median wages of $50,970 and $48,660, respectively. Carpenters fall somewhere in between, with a median wage of $59,310.
Electrical tools are expensive to replace—and easy targets for theft
From meters to cordless gear, electricians depend on equipment that’s costly and often stored in vehicles or onsite. Tools and equipment insurance helps cover sudden losses so your business isn’t set back by stolen or damaged gear.
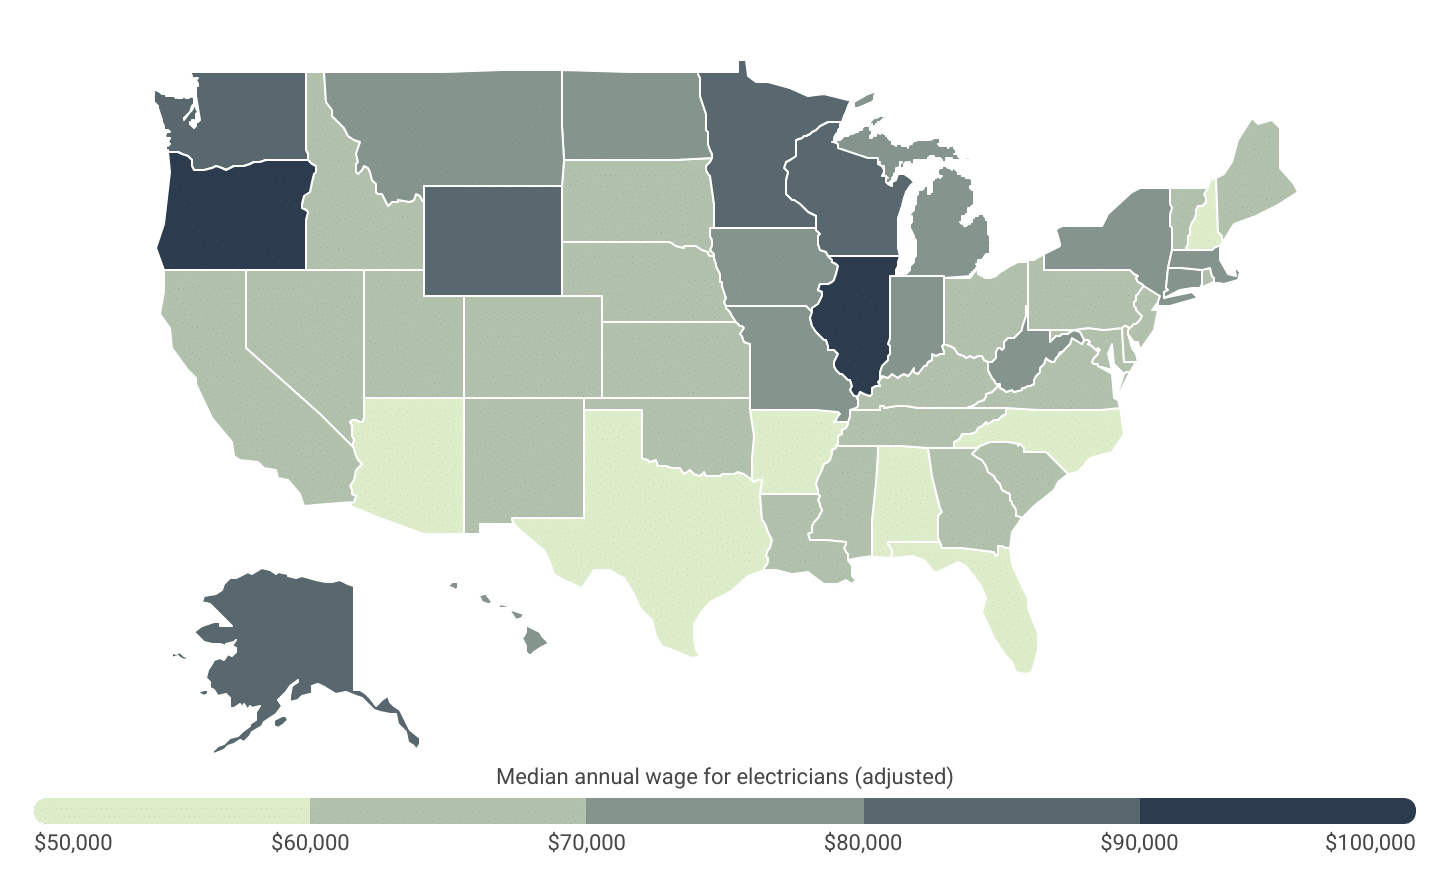
Cost-of-Living-Adjusted Pay: Real Electrician Wages by State
Illinois, Oregon, and Washington offer the best compensation for electricians—all over $88K per year
Data: Regional Differences in Median Electrician Salary
| State | Median Annual Wage for Electricians (Adjusted) |
|---|---|
| Illinois | $97,476 |
| Oregon | $92,933 |
| Washington | $88,917 |
| Minnesota | $82,740 |
| Wyoming | $80,849 |
| Wisconsin | $80,658 |
| Alaska | $80,480 |
| Missouri | $77,320 |
| Michigan | $77,168 |
| Hawaii | $76,605 |
| Montana | $76,437 |
| Massachusetts | $75,870 |
| North Dakota | $74,312 |
| Connecticut | $74,058 |
| New York | $71,971 |
| West Virginia | $71,125 |
| Indiana | $71,032 |
| Iowa | $70,837 |
| Maine | $69,848 |
| Ohio | $69,228 |
| Rhode Island | $69,183 |
| Kansas | $68,727 |
| Oklahoma | $68,018 |
| California | $67,987 |
| Louisiana | $67,451 |
| New Jersey | $67,127 |
| Pennsylvania | $67,077 |
| Nevada | $66,973 |
| South Dakota | $66,462 |
| Nebraska | $66,411 |
| Idaho | $66,360 |
| Kentucky | $65,758 |
| Mississippi | $65,642 |
| Utah | $64,662 |
| Tennessee | $63,979 |
| Delaware | $63,444 |
| Maryland | $63,146 |
| New Mexico | $62,941 |
| South Carolina | $62,526 |
| Vermont | $61,748 |
| Colorado | $61,244 |
| Virginia | $61,152 |
| Georgia | $60,869 |
| New Hampshire | $58,845 |
| Arizona | $58,830 |
| Texas | $58,575 |
| Alabama | $58,264 |
| North Carolina | $57,436 |
| Arkansas | $57,128 |
| Florida | $51,328 |
Location plays a key role in the earning potential for electricians, with Midwestern and Western states offering some of the highest wages when adjusted for cost of living. Illinois leads the nation at an adjusted median annual wage of $97,476, followed by Oregon at $92,933 and Washington at $88,917. In the Midwest, lower living costs help boost the relative value of wages in states like Wisconsin ($80,658), Missouri ($77,320), and Michigan ($77,168). In contrast, electricians in Oregon and Washington benefit from higher nominal wages that more than offset the region’s higher costs, keeping their adjusted earnings strong.
Alaska ($80,480) and Hawaii ($76,605) are two more examples of high-cost Western states that offer strong wages to electricians even after accounting for the cost of living. Despite being the third most expensive state in the country, Hawaii ranks tenth nationwide for adjusted electrician pay. In general, Western states benefit from relatively high unionization rates, which help drive up nominal wages. Alaska, in particular, also sees strong demand for skilled electricians due to its sizable oil and gas industry.
In contrast, Southern states generally pay lower wages to electricians—and to construction workers overall—reflecting weaker unions and economies less dependent on industries that require skilled electrical work. Seven of the 10 lowest-paying states for electricians are in the South.
The same factors are at play at the metro level, and accordingly, locations in Florida and Texas are overrepresented among the lowest-paying metropolitan areas for electricians, even when factoring in the states’ relatively lower living costs compared to other large states like California. On the other hand, locations in Illinois—like Chicago, Decatur, and Champaign—stand out as offering some of the best compensation for the nation’s electricians.
Accurate takeoffs are critical for competitive electrical bids
Electricians estimate labor and materials from dense plan sets, where small quantity errors can wipe out a project’s profit. Electrical takeoff tools—like Countfire, built specifically for electrical estimating—help automate counts and measurements so bids stay precise and consistent.
Below is a complete breakdown of cost-of-living-adjusted electrician pay for more than 370 metropolitan areas (grouped by size) and all 50 states. The analysis was conducted by researchers at Construction Coverage, using data from the U.S. Bureau of Labor Statistics and the U.S. Bureau of Economic Analysis. For more information, refer to the methodology section.
The Top-Paying Cities for Electricians
| Top Large Metros | Wage* |
|---|---|
| 1. Chicago-Naperville-Elgin, IL-IN | $97,058 |
| 2. Portland-Vancouver-Hillsboro, OR-WA | $95,737 |
| 3. Minneapolis-St. Paul-Bloomington, MN-WI | $90,987 |
| 4. Seattle-Tacoma-Bellevue, WA | $89,919 |
| 5. San Jose-Sunnyvale-Santa Clara, CA | $84,188 |
| 6. Buffalo-Cheektowaga, NY | $83,258 |
| 7. St. Louis, MO-IL | $82,316 |
| 8. Detroit-Warren-Dearborn, MI | $81,964 |
| 9. Milwaukee-Waukesha, WI | $80,409 |
| 10. Kansas City, MO-KS | $79,943 |
| 11. San Francisco-Oakland-Fremont, CA | $79,298 |
| 12. Rochester, NY | $76,515 |
| 13. Hartford-West Hartford-East Hartford, CT | $74,867 |
| 14. Boston-Cambridge-Newton, MA-NH | $74,793 |
| 15. Philadelphia-Camden-Wilmington, PA-NJ-DE-MD | $71,504 |
| Bottom Large Metros | Wage* |
|---|---|
| 1. Miami-Fort Lauderdale-West Palm Beach, FL | $50,150 |
| 2. Orlando-Kissimmee-Sanford, FL | $51,311 |
| 3. Tampa-St. Petersburg-Clearwater, FL | $52,005 |
| 4. Dallas-Fort Worth-Arlington, TX | $55,919 |
| 5. Raleigh-Cary, NC | $55,945 |
| 6. San Antonio-New Braunfels, TX | $56,174 |
| 7. Jacksonville, FL | $56,322 |
| 8. Phoenix-Mesa-Chandler, AZ | $56,802 |
| 9. Charlotte-Concord-Gastonia, NC-SC | $57,528 |
| 10. Birmingham, AL | $58,097 |
| 11. Houston-Pasadena-The Woodlands, TX | $59,050 |
| 12. Denver-Aurora-Centennial, CO | $59,731 |
| 13. Atlanta-Sandy Springs-Roswell, GA | $59,842 |
| 14. Tucson, AZ | $60,289 |
| 15. Austin-Round Rock-San Marcos, TX | $60,479 |
| Top Midsize Metros | Wage* |
|---|---|
| 1. Peoria, IL | $98,999 |
| 2. Canton-Massillon, OH | $91,621 |
| 3. Davenport-Moline-Rock Island, IA-IL | $87,831 |
| 4. Flint, MI | $87,763 |
| 5. Ann Arbor, MI | $83,721 |
| 6. Lansing-East Lansing, MI | $82,987 |
| 7. Trenton-Princeton, NJ | $82,238 |
| 8. Springfield, MA | $81,852 |
| 9. Eugene-Springfield, OR | $81,600 |
| 10. Madison, WI | $80,972 |
| 11. Salem, OR | $80,793 |
| 12. Toledo, OH | $80,627 |
| 13. Akron, OH | $80,225 |
| 14. Spokane-Spokane Valley, WA | $78,421 |
| 15. Urban Honolulu, HI | $77,699 |
| Bottom Midsize Metros | Wage* |
|---|---|
| 1. North Port-Bradenton-Sarasota, FL | $48,902 |
| 2. Cape Coral-Fort Myers, FL | $49,101 |
| 3. Deltona-Daytona Beach-Ormond Beach, FL | $49,776 |
| 4. Tallahassee, FL | $50,189 |
| 5. Ocala, FL | $50,437 |
| 6. Pensacola-Ferry Pass-Brent, FL | $51,130 |
| 7. Lakeland-Winter Haven, FL | $51,143 |
| 8. Gainesville, FL | $51,613 |
| 9. El Paso, TX | $51,617 |
| 10. Wilmington, NC | $51,685 |
| 11. Killeen-Temple, TX | $51,830 |
| 12. Lubbock, TX | $52,141 |
| 13. Port St. Lucie, FL | $52,225 |
| 14. McAllen-Edinburg-Mission, TX | $52,376 |
| 15. Jackson, MS | $52,509 |
| Top Small Metros | Wage* |
|---|---|
| 1. Decatur, IL | $118,886 |
| 2. Kennewick-Richland, WA | $109,852 |
| 3. Champaign-Urbana, IL | $100,621 |
| 4. Wenatchee-East Wenatchee, WA | $100,138 |
| 5. Kokomo, IN | $99,257 |
| 6. St. Cloud, MN | $97,612 |
| 7. Mount Vernon-Anacortes, WA | $97,408 |
| 8. Duluth, MN-WI | $96,539 |
| 9. Fairbanks-College, AK | $94,312 |
| 10. Bloomington, IL | $94,183 |
| 11. Mankato, MN | $93,796 |
| 12. St. Joseph, MO-KS | $92,856 |
| 13. Corvallis, OR | $91,502 |
| 14. Albany, OR | $91,493 |
| 15. Springfield, IL | $91,122 |
| Bottom Small Metros | Wage* |
|---|---|
| 1. Panama City-Panama City Beach, FL | $49,428 |
| 2. Homosassa Springs, FL | $50,077 |
| 3. Hilton Head Island-Bluffton-Port Royal, SC | $50,129 |
| 4. Sebring, FL | $51,184 |
| 5. Gadsden, AL | $51,413 |
| 6. Laredo, TX | $51,626 |
| 7. Punta Gorda, FL | $51,749 |
| 8. Goldsboro, NC | $51,799 |
| 9. San Angelo, TX | $51,921 |
| 10. Burlington, NC | $52,001 |
| 11. Daphne-Fairhope-Foley, AL | $52,245 |
| 12. Wichita Falls, TX | $52,804 |
| 13. Abilene, TX | $52,866 |
| 14. Waco, TX | $52,916 |
| 15. Hattiesburg, MS | $52,999 |
The Top-Paying States for Electricians
| Top States | Wage* |
|---|---|
| 1. Illinois | $97,476 |
| 2. Oregon | $92,933 |
| 3. Washington | $88,917 |
| 4. Minnesota | $82,740 |
| 5. Wyoming | $80,849 |
| 6. Wisconsin | $80,658 |
| 7. Alaska | $80,480 |
| 8. Missouri | $77,320 |
| 9. Michigan | $77,168 |
| 10. Hawaii | $76,605 |
| 11. Montana | $76,437 |
| 12. Massachusetts | $75,870 |
| 13. North Dakota | $74,312 |
| 14. Connecticut | $74,058 |
| 15. New York | $71,971 |
| Bottom States | Wage* |
|---|---|
| 1. Florida | $51,328 |
| 2. Arkansas | $57,128 |
| 3. North Carolina | $57,436 |
| 4. Alabama | $58,264 |
| 5. Texas | $58,575 |
| 6. Arizona | $58,830 |
| 7. New Hampshire | $58,845 |
| 8. Georgia | $60,869 |
| 9. Virginia | $61,152 |
| 10. Colorado | $61,244 |
| 11. Vermont | $61,748 |
| 12. South Carolina | $62,526 |
| 13. New Mexico | $62,941 |
| 14. Maryland | $63,146 |
| 15. Delaware | $63,444 |
*Median annual wage for electricians (adjusted)
Full Results
Methodology
To determine the best-paying metros for electricians, researchers at Construction Coverage analyzed the latest data from the U.S. Bureau of Labor Statistics’ 2024 Occupational Employment and Wage Statistics and the U.S. Bureau of Economic Analysis’ 2023 Regional Price Parities. The researchers ranked metropolitan areas according to the cost-of-living-adjusted median annual wage for electricians. In the event of a tie, the location with the larger unadjusted median annual wage for electricians was ranked higher.
Only metropolitan areas with available data were included in the analysis. Additionally, metro areas were grouped into the following cohorts based on population size:
- Small metros: under 350,000
- Midsize metros: 350,000–999,999
- Large metros: 1,000,000 or more
References
- U.S. Department of Energy (December 20, 2024). DOE Releases New Report Evaluating Increase in Electricity Demand from Data Centers. https://www.energy.gov/articles/doe-releases-new-report-evaluating-increase-electricity-demand-data-centers.
- Groom, Nichola and Valcovici, Valerie (January 11, 2023). Insight: Biden’s climate agenda has a problem: Not enough workers. Reuters. https://www.reuters.com/business/energy/bidens-climate-agenda-has-problem-not-enough-workers-2023-01-11/.
- U.S. Bureau of Labor Statistics (2024). Occupational Employment and Wage Statistics. https://www.bls.gov/oes/.
- U.S. Bureau of Economic Analysis (2023). Regional Price Parities. https://www.bea.gov/data/prices-inflation/regional-price-parities-state-and-metro-area.