
Best-Paying U.S. States for Woodworkers in 2022
The last few years have brought rising demand for housing construction, home improvement projects, and durable goods. But amid supply chain challenges and an unusual labor market since the COVID-19 pandemic began, construction and related businesses have had a hard time keeping up with demand. Consumers have endured rising prices and delays on projects and big purchases as a result.
Unfilled jobs in construction and production occupations are a primary cause of the challenges the field currently faces. Construction industry experts have estimated a workforce shortage in the industry of 650,000 in 2022, the product of both today’s high demand and years of inadequate training and hiring in the field. On top of this, production occupations—many of which are vital for manufacturing the materials and fixtures needed to complete construction projects—have also experienced a sustained decline in employment over time.
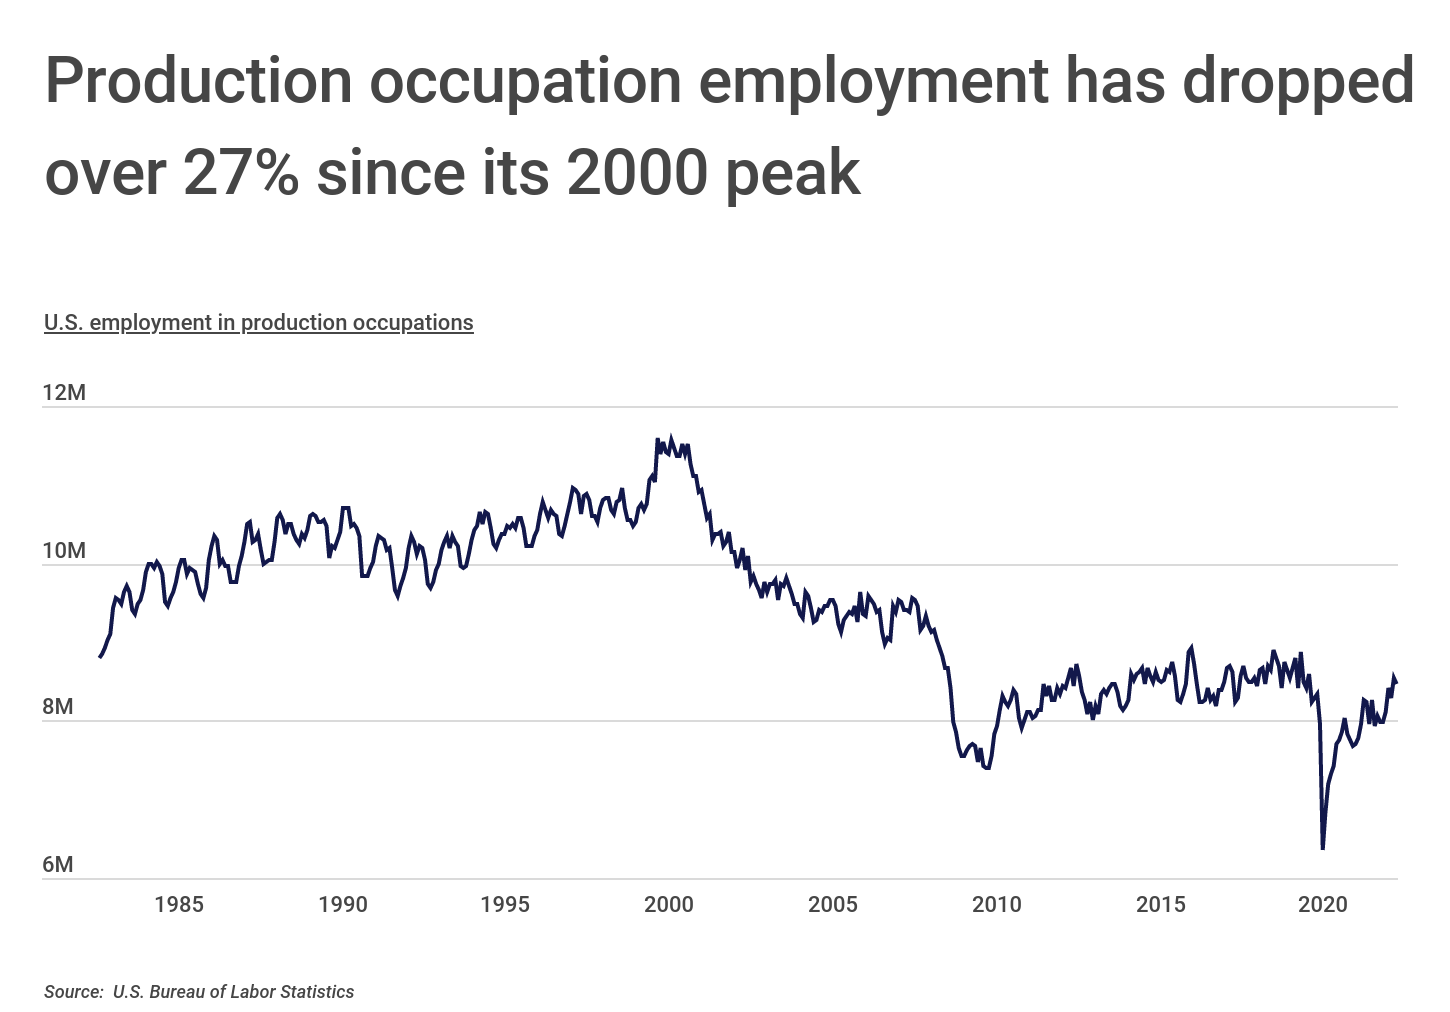
Over the last two decades, the number of production workers in the U.S. has fallen off substantially as economic forces like globalization and especially automation have eliminated jobs. U.S. employment in production occupations reached a peak of 11.6 million early in the year 2000 and has declined by 27% since. Today, just 8.4 million people hold production jobs in the U.S. While advances in automation have helped keep productivity up, these job losses are a challenge given recent demand.
Prospects among production occupations vary, as some fields have experienced greater decline than others. Production jobs like metal and plastic machine workers or assemblers and fabricators are projected to see continued employment declines in future years, while a number of others are expected to keep pace or even exceed growth in other fields. Production jobs that are expected to fare better include positions like machinists, which have new opportunities from advanced manufacturing, and certain skilled trades, like welders, which are harder to replace through automation.
Woodworkers are one example of the latter category. These professionals manufacture products like cabinets, furniture, and even windows using wood, veneers, and laminates. According to the Bureau of Labor Statistics, employment in the field is expected to grow by 8% by 2030, which is in line with the growth expected across all occupations.
RELATED
Woodworkers, like all production and trade occupations, have a high degree of liability exposure. Woodworking businesses should, at a minimum, have a contractors general liability insurance policy and a commercial property policy. These will protect the business from third-party liability suits and also protect business property in the event of damage or theft.
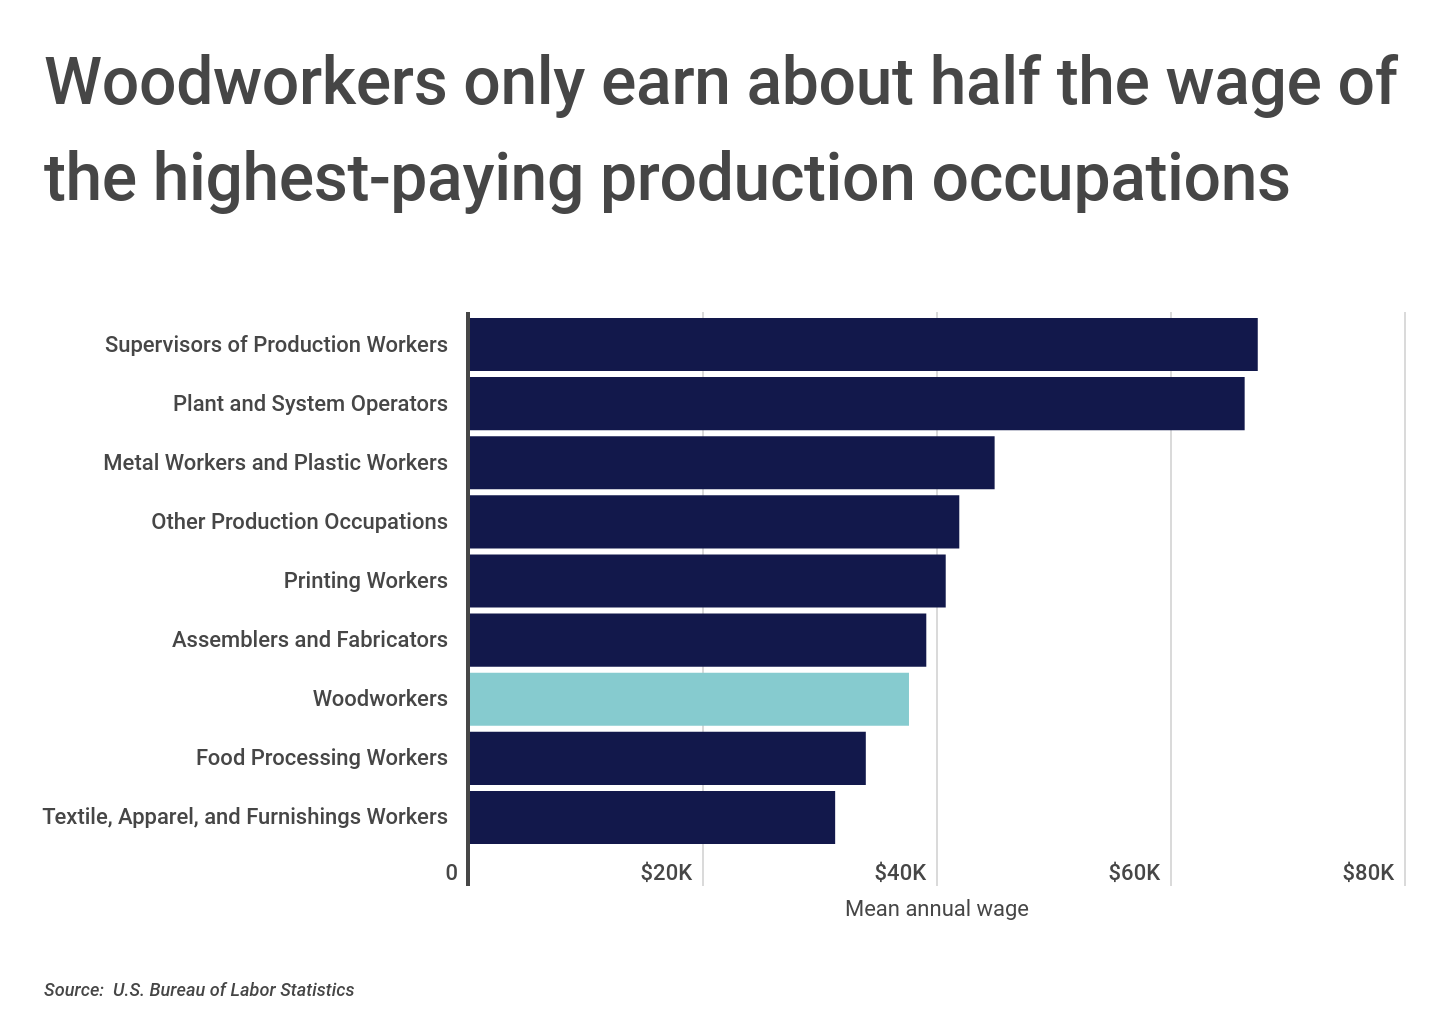
But one ongoing challenge for production occupations, including woodworking, is compensation. While jobs are available, typical rates of pay are not high enough to attract workers to the field. The average annual wage for a U.S. woodworker is $37,520, just over half the wage for higher-paying production occupations like supervisors of production ($67,330) or plant and system operators ($66,210). And wages for woodworking and many other production jobs are low relative to the rest of the economy, as the overall mean wage in the U.S. is $58,260 per year.
RELATED
Woodworkers who travel to work at different locations should also have tools and equipment insurance as well as commercial auto insurance. These policies will cover tools and business vehicles while in transit.
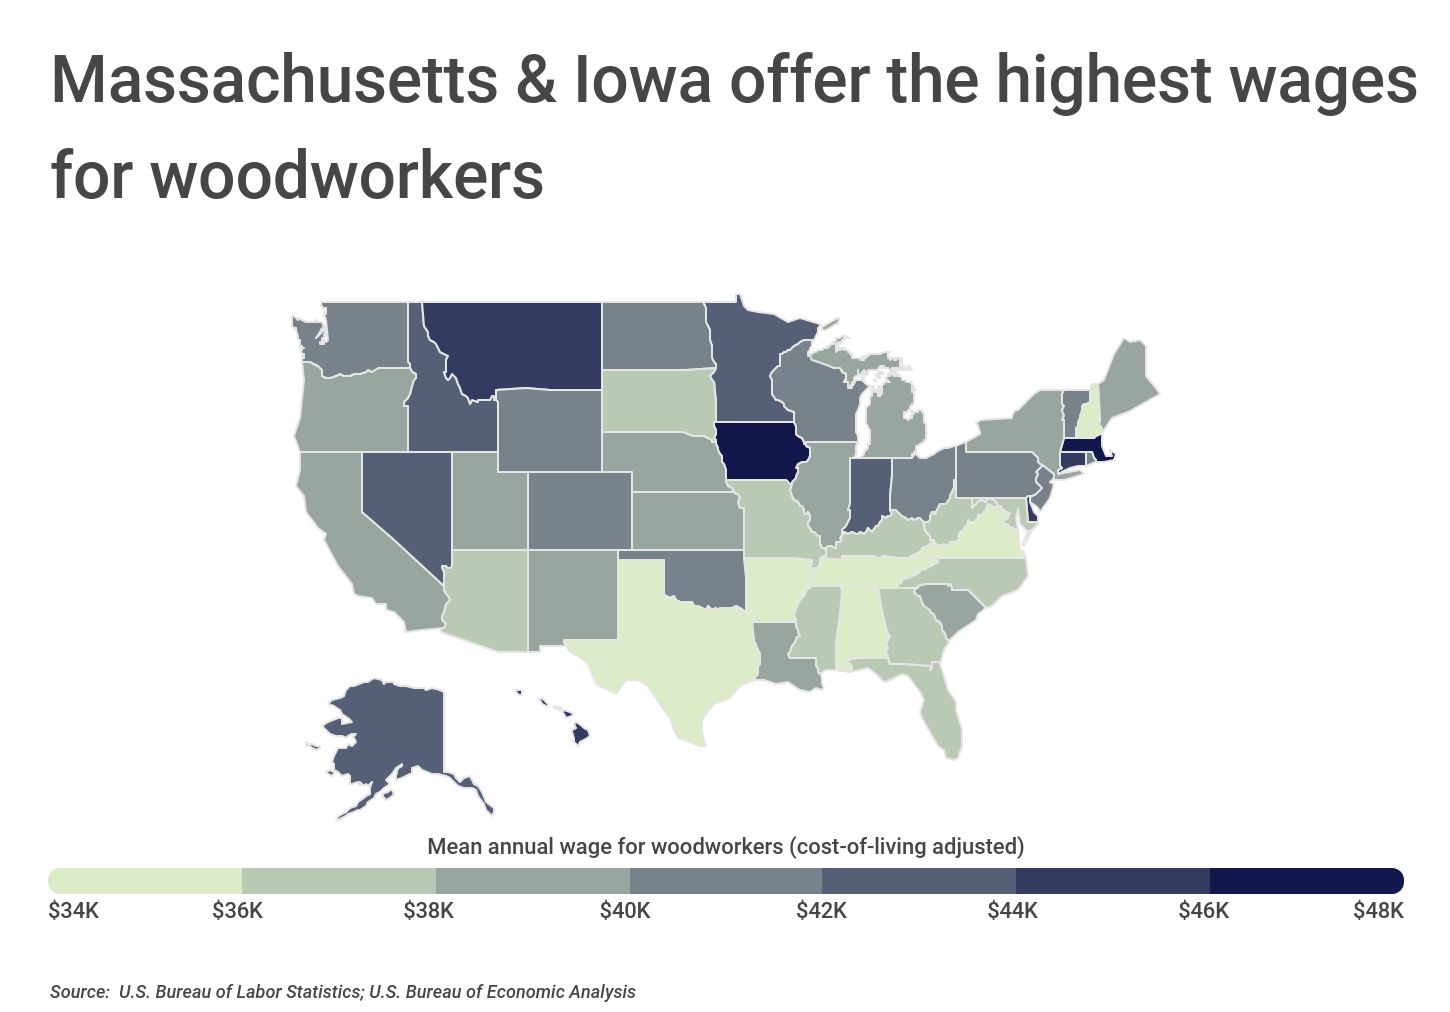
Woodworkers’ compensation varies across the country, however. Many states in the South have lower wages for woodworkers. Texas offers the least favorable wages for woodworkers, with an average cost-of-living-adjusted wage of $33,820, and four other Southern states follow as the lowest-paying states. But some other locations offer solid wages for professionals in the field. National leaders Massachusetts, Iowa, and Delaware each offer average adjusted wages above $45,000 per year.
The data used in this analysis is from the U.S. Bureau of Labor Statistics and the U.S. Bureau of Economic Analysis. To determine the best-paying states for woodworkers, researchers at Construction Coverage calculated the mean annual wage for woodworkers, adjusted for cost of living.
Here are the best-paying states for woodworkers.
Best-Paying States for Woodworkers
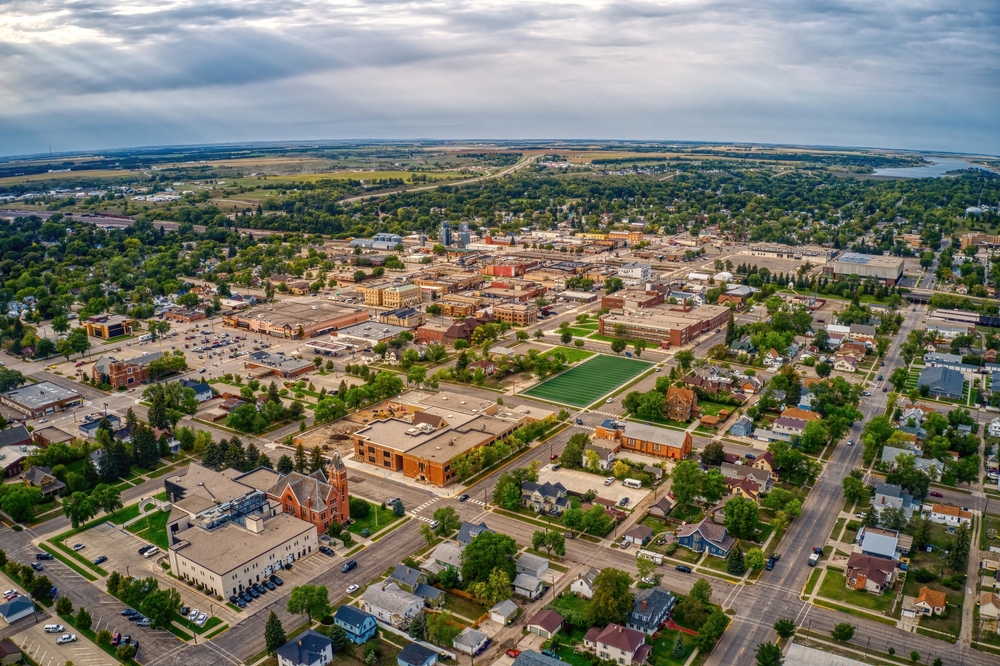
Photo Credit: Jacob Boomsma / Shutterstock
15. North Dakota
- Mean annual wage for woodworkers (adjusted): $41,112
- Mean annual wage for woodworkers (unadjusted): $37,840
- Mean annual wage for all production occupations: $51,780
- Mean annual wage for all occupations: $53,380

Photo Credit: Jess Kraft / Shutterstock
14. Wyoming
- Mean annual wage for woodworkers (adjusted): $41,504
- Mean annual wage for woodworkers (unadjusted): $38,290
- Mean annual wage for all production occupations: $58,840
- Mean annual wage for all occupations: $52,110

Photo Credit: Sean Pavone / Shutterstock
13. New Jersey
- Mean annual wage for woodworkers (adjusted): $41,511
- Mean annual wage for woodworkers (unadjusted): $46,145
- Mean annual wage for all production occupations: $45,500
- Mean annual wage for all occupations: $67,120

Photo Credit: Richard Cavalleri / Shutterstock
12. Rhode Island
- Mean annual wage for woodworkers (adjusted): $41,521
- Mean annual wage for woodworkers (unadjusted): $42,287
- Mean annual wage for all production occupations: $45,580
- Mean annual wage for all occupations: $62,120

Photo Credit: Dave Riewe / Shutterstock
11. Minnesota
- Mean annual wage for woodworkers (adjusted): $42,372
- Mean annual wage for woodworkers (unadjusted): $41,789
- Mean annual wage for all production occupations: $44,440
- Mean annual wage for all occupations: $60,480

Photo Credit: Charles Knowles / Shutterstock
10. Idaho
- Mean annual wage for woodworkers (adjusted): $42,446
- Mean annual wage for woodworkers (unadjusted): $38,709
- Mean annual wage for all production occupations: $39,740
- Mean annual wage for all occupations: $47,940

Photo Credit: Rudy Balasko / Shutterstock
9. Indiana
- Mean annual wage for woodworkers (adjusted): $42,569
- Mean annual wage for woodworkers (unadjusted): $39,377
- Mean annual wage for all production occupations: $43,800
- Mean annual wage for all occupations: $50,440

Photo Credit: Jacob Boomsma / Shutterstock
8. Alaska
- Mean annual wage for woodworkers (adjusted): $42,910
- Mean annual wage for woodworkers (unadjusted): $44,300
- Mean annual wage for all production occupations: $53,930
- Mean annual wage for all occupations: $63,480

Photo Credit: f11photo / Shutterstock
7. Nevada
- Mean annual wage for woodworkers (adjusted): $43,270
- Mean annual wage for woodworkers (unadjusted): $41,996
- Mean annual wage for all production occupations: $42,290
- Mean annual wage for all occupations: $51,080

Photo Credit: Mihai Andritoiu / Shutterstock
6. Montana
- Mean annual wage for woodworkers (adjusted): $44,440
- Mean annual wage for woodworkers (unadjusted): $41,082
- Mean annual wage for all production occupations: $44,370
- Mean annual wage for all occupations: $49,340

Photo Credit: Wendell Guy / Shutterstock
5. Connecticut
- Mean annual wage for woodworkers (adjusted): $44,547
- Mean annual wage for woodworkers (unadjusted): $46,079
- Mean annual wage for all production occupations: $50,460
- Mean annual wage for all occupations: $66,130

Photo Credit: Izabela23 / Shutterstock
4. Hawaii
- Mean annual wage for woodworkers (adjusted): $44,965
- Mean annual wage for woodworkers (unadjusted): $50,354
- Mean annual wage for all production occupations: $50,170
- Mean annual wage for all occupations: $59,760

Photo Credit: Jon Bilous / Shutterstock
3. Delaware
- Mean annual wage for woodworkers (adjusted): $45,396
- Mean annual wage for woodworkers (unadjusted): $44,430
- Mean annual wage for all production occupations: $43,110
- Mean annual wage for all occupations: $59,820
Photo Credit: Jacob Boomsma / Shutterstock
2. Iowa
- Mean annual wage for woodworkers (adjusted): $46,140
- Mean annual wage for woodworkers (unadjusted): $42,009
- Mean annual wage for all production occupations: $41,980
- Mean annual wage for all occupations: $51,140

Photo Credit: Travellaggio / Shutterstock
1. Massachusetts
- Mean annual wage for woodworkers (adjusted): $47,948
- Mean annual wage for woodworkers (unadjusted): $51,516
- Mean annual wage for all production occupations: $47,150
- Mean annual wage for all occupations: $72,940
Detailed Findings & Methodology
The data used in this analysis is from the U.S. Bureau of Labor Statistics’ Occupational Employment and Wage Statistics and the U.S. Bureau of Economic Analysis’ Regional Price Parities. To determine the best-paying states for woodworkers, researchers at Construction Coverage calculated the mean annual wage for woodworkers, adjusted for cost of living. Mean annual wage values were computed by taking all available mean annual wages for individual woodworking occupations and calculating a weighted average by total employment in each occupation.