
Cities With the Fastest-Growing Wages for Construction Workers
Note: This is the most recent release of our Cities With the Fastest-Growing Wages for Construction Workers study. To see data from prior years, please visit the Full Results section below.
Wage growth is routinely touted as one positive aspect of the COVID-era economy. However, high levels of inflation beginning in 2021 have, in many cases, more than offset increases in pay. In the construction industry, for example, the average worker has less purchasing power today than in the years leading up to the pandemic. Despite persistent labor shortages and record levels of spending, the absolute changes in earnings for construction workers have failed to keep pace with rising costs.
Construction Wage Growth Compared
Over the past 5 years, wage growth for construction workers has trailed the national average
FOR EMPLOYERS
Workers’ comp is required (in some capacity) in nearly every state. In certain states, not having workers’ compensation insurance can result in serious legal consequences, including fines or jail time.
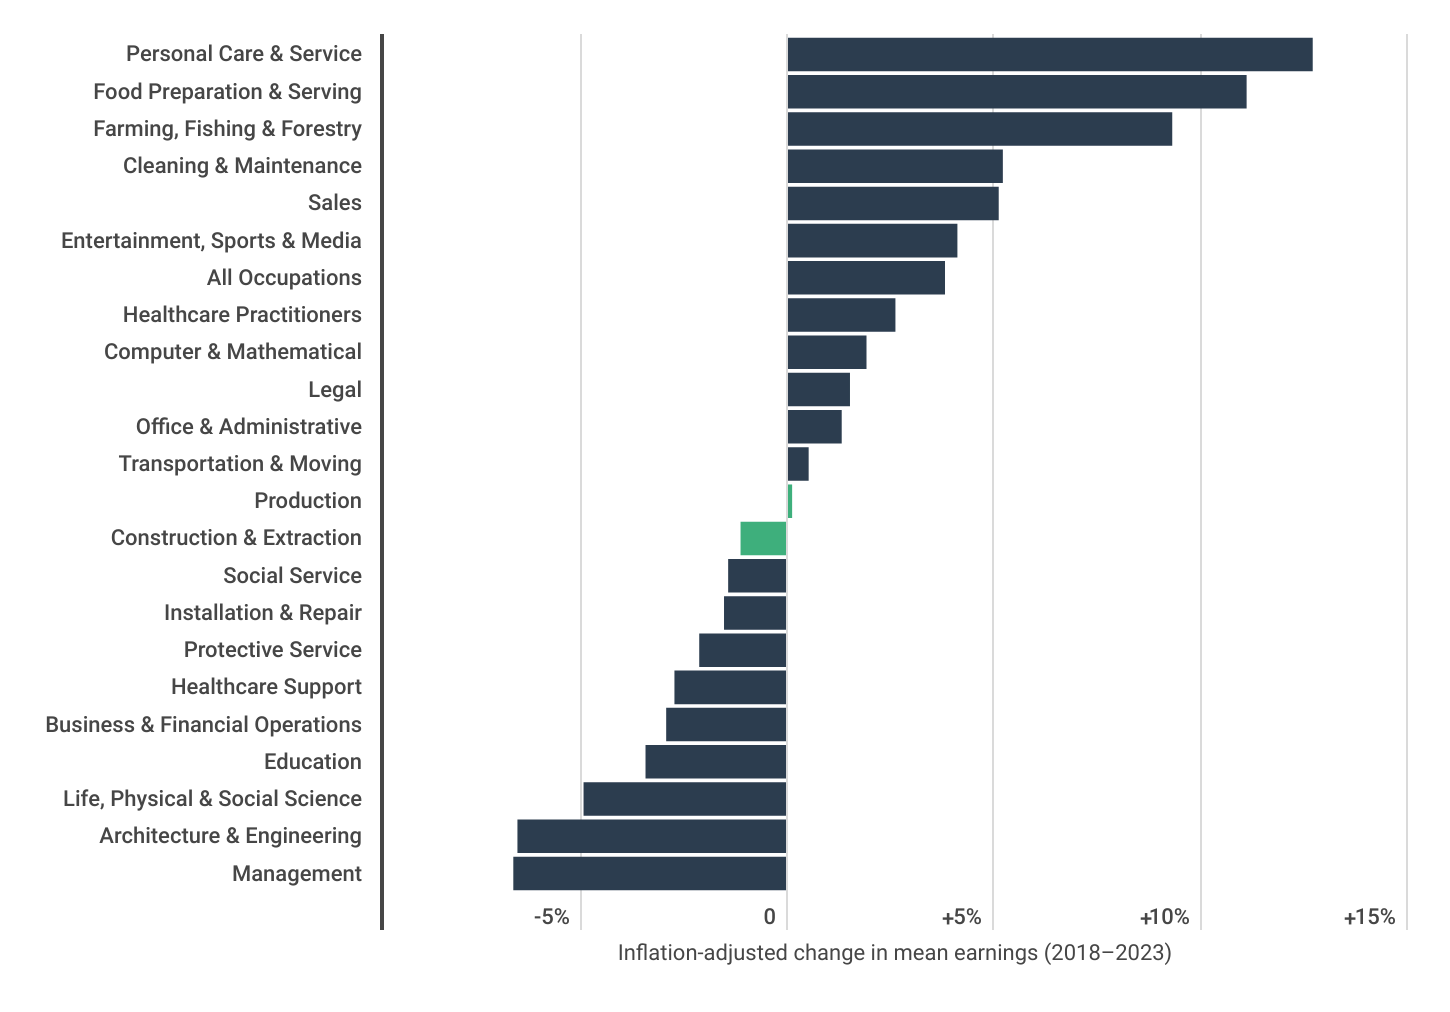
Nationally, construction and extraction workers—a group which includes trades workers, laborers, equipment operators, inspectors, and other similar professions—earned an average annual wage of $61,500 in 2023, up from $51,220 in 2018. While on a nominal basis, this marks a 20.1% increase in pay, when adjusted for inflation, it represents a 1.1% decrease in purchasing power.
Among the 22 major occupational groups tracked by the U.S. Bureau of Labor Statistics, 12 recorded growth in purchasing power between 2018 and 2023, while 10 (including construction and extraction) showed declines. Generally, lower-wage occupations that require less education experienced the most significant growth in pay, led by personal care and service occupations, food preparation and serving occupations, and farming, fishing, and forestry occupations.
The occupational groups that saw the most significant decreases in pay were management occupations and architecture and engineering occupations. On average across all occupations, there was a positive change of 3.8% over the five-year period after adjusting for inflation.
Construction Wage Growth by State
Construction workers in Maine & Nevada have experienced the most wage growth since 2018
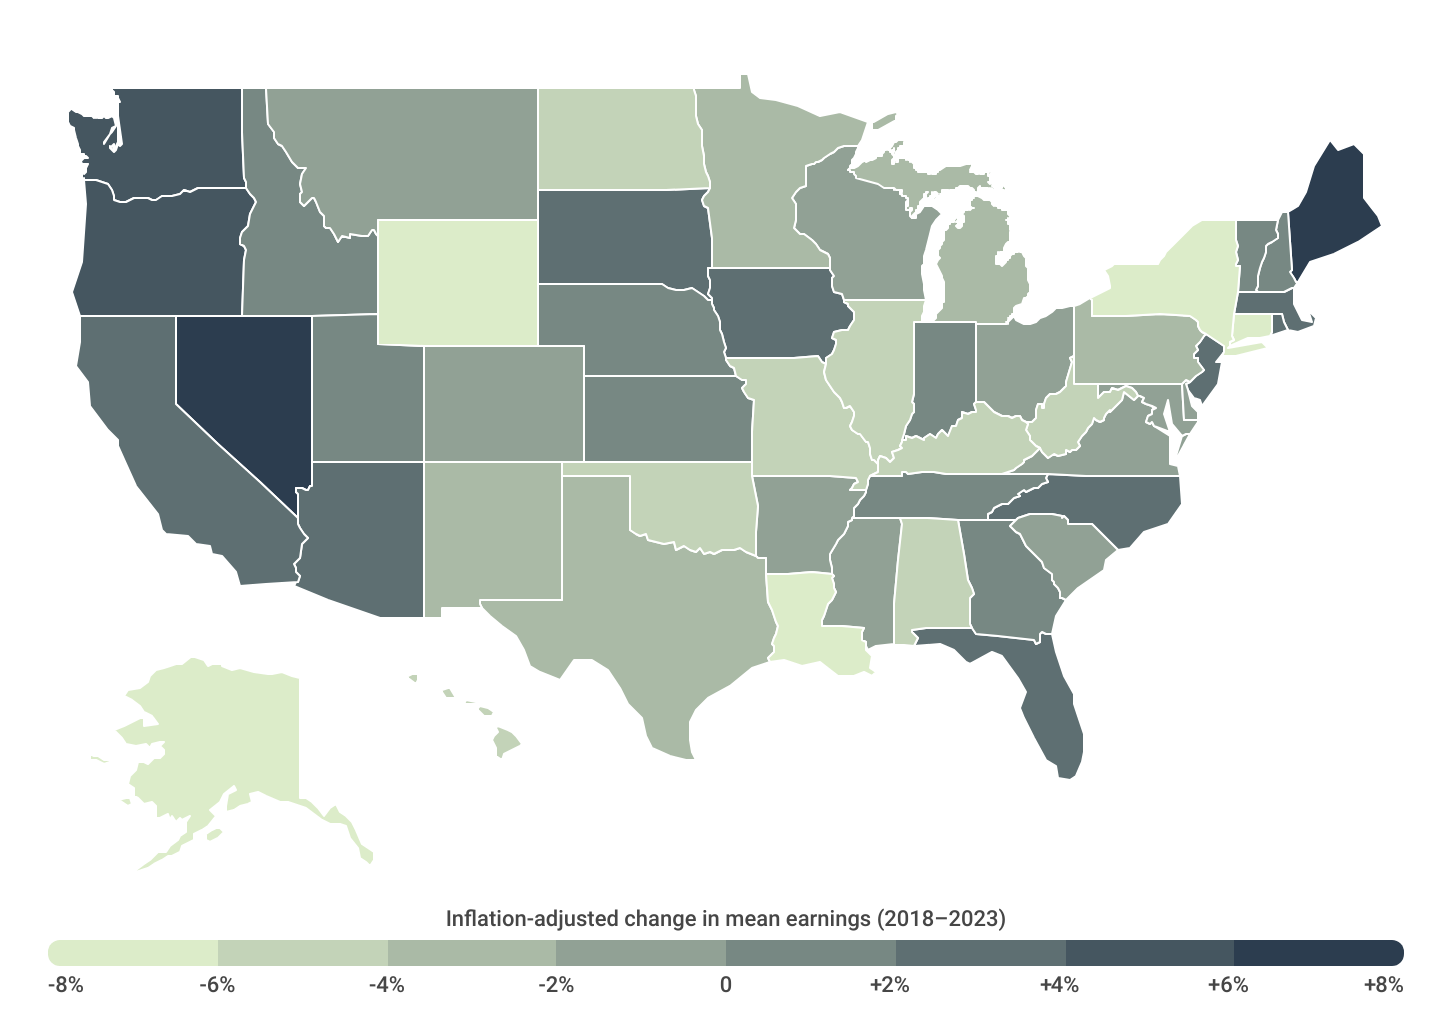
Despite below-average wage growth nationally, construction workers in certain parts of the country have fared better. In 22 states, inflation-adjusted construction wages showed positive growth over the past five years. Leading this list are Maine (+6.2%), Nevada (+6.0%), Washington (+4.8%), and Oregon (+4.4%). Even as inflation has offset wage gains, the average construction worker in these states still has more purchasing power today than in 2018.
Conversely, the wage gains experienced by construction workers in 28 states failed to keep pace with inflation, resulting in a net loss of purchasing power. Among the least favorable states for construction wage growth are Wyoming (-7.3%), Alaska (-6.4%), and New York (-6.4%).
At the local level, major metropolitan areas in many of these top states rank highly, such as Portland, ME; Las Vegas, NV; Portland, OR; and Seattle, WA. However, several locations in Georgia and California also stand out.
Below is a complete breakdown of construction wage growth for nearly 400 U.S. metropolitan areas and all 50 states. The analysis was conducted by Construction Coverage, using data from the U.S. Bureau of Labor Statistics. For more information, see the methodology section below.
RELATED
The construction industry has changed a lot in the last five years. New technologies like estimating software and construction accounting software have helped eliminate tedious portions of running a construction business.
Large Metros With the Most Wage Growth
| Top Metros | Change* |
|---|---|
| 1. San Jose-Sunnyvale-Santa Clara, CA | +8.7% |
| 2. Miami-Fort Lauderdale-West Palm Beach, FL | +7.5% |
| 3. Las Vegas-Henderson-Paradise, NV | +7.4% |
| 4. Columbus, OH | +7.1% |
| 5. Portland-Vancouver-Hillsboro, OR-WA | +6.0% |
| 6. Sacramento–Roseville–Arden-Arcade, CA | +5.9% |
| 7. Tucson, AZ | +5.7% |
| 8. Seattle-Tacoma-Bellevue, WA | +5.0% |
| 9. Fresno, CA | +4.4% |
| 10. Memphis, TN-MS-AR | +4.4% |
| 11. Grand Rapids-Wyoming, MI | +4.2% |
| 12. Tampa-St. Petersburg-Clearwater, FL | +3.6% |
| 13. Cincinnati, OH-KY-IN | +3.4% |
| 14. Nashville-Davidson–Murfreesboro–Franklin, TN | +3.3% |
| 15. Phoenix-Mesa-Scottsdale, AZ | +3.1% |
| Bottom Metros | Change* |
|---|---|
| 1. Philadelphia-Camden-Wilmington, PA-NJ-DE-MD | -7.1% |
| 2. Hartford-West Hartford-East Hartford, CT | -6.9% |
| 3. Birmingham-Hoover, AL | -6.7% |
| 4. Houston-The Woodlands-Sugar Land, TX | -6.7% |
| 5. Chicago-Naperville-Elgin, IL-IN-WI | -6.4% |
| 6. Oklahoma City, OK | -6.1% |
| 7. St. Louis, MO-IL | -5.2% |
| 8. Pittsburgh, PA | -5.2% |
| 9. Detroit-Warren-Dearborn, MI | -5.1% |
| 10. New York-Newark-Jersey City, NY-NJ-PA | -4.7% |
| 11. Milwaukee-Waukesha-West Allis, WI | -4.7% |
| 12. Virginia Beach-Norfolk-Newport News, VA-NC | -4.4% |
| 13. Minneapolis-St. Paul-Bloomington, MN-WI | -3.6% |
| 14. Kansas City, MO-KS | -3.5% |
| 15. Louisville/Jefferson County, KY-IN | -3.3% |
States With the Most Wage Growth
| Top States | Change* |
|---|---|
| 1. Maine | +6.2% |
| 2. Nevada | +6.0% |
| 3. Washington | +4.8% |
| 4. Oregon | +4.4% |
| 5. South Dakota | +3.7% |
| 6. Florida | +3.2% |
| 7. Arizona | +3.2% |
| 8. New Jersey | +3.1% |
| 9. California | +2.6% |
| 10. North Carolina | +2.5% |
| 11. Massachusetts | +2.4% |
| 12. Iowa | +2.3% |
| 13. Rhode Island | +2.0% |
| 14. Idaho | +1.9% |
| 15. Tennessee | +1.4% |
| Bottom States | Change* |
|---|---|
| 1. Wyoming | -7.3% |
| 2. Alaska | -6.4% |
| 3. New York | -6.4% |
| 4. Connecticut | -6.3% |
| 5. Louisiana | -6.1% |
| 6. Kentucky | -6.0% |
| 7. Illinois | -5.4% |
| 8. West Virginia | -5.3% |
| 9. Alabama | -4.8% |
| 10. North Dakota | -4.6% |
| 11. Hawaii | -4.4% |
| 12. Oklahoma | -4.3% |
| 13. Missouri | -4.1% |
| 14. Pennsylvania | -4.0% |
| 15. New Mexico | -3.3% |
*Inflation-adjusted change in mean earnings (2018–2023)
FOR CONSTRUCTION PROFESSIONALS
One of the most important components of running a construction business is insurance. Builders risk is a form of insurance that covers buildings and structures during the course of construction.
Full Results
Methodology
To find the locations with the fastest-growing wages for construction workers, researchers at Construction Coverage analyzed the latest data from the U.S. Bureau of Labor Statistics 2023 Occupational Employment and Wage Statistics. The researchers ranked locations according to the inflation-adjusted change in mean construction worker earnings from 2018 to 2023. Researchers also calculated the unadjusted change in mean earnings from 2018 to 2023, mean annual earnings for 2023 and 2018, and the concentration of construction workers’ compared to the national share. To improve relevance, metropolitan areas were grouped into the following cohorts based on population size: small (less than 350,000), midsize (350,000–999,999), and large (1,000,000 or more).
References
- Associated Builders and Contractors (January 31, 2024). ABC: 2024 Construction Workforce Shortage Tops Half a Million. https://www.abc.org/News-Media/News-Releases/abc-2024-construction-workforce-shortage-tops-half-a-million.
- U.S. Census Bureau (June 3, 2024). Total Construction Spending: Total Construction in the United States. https://fred.stlouisfed.org/series/TTLCONS.
- U.S. Bureau of Labor Statistics (2023). Occupational Employment and Wage Statistics. https://www.bls.gov/oes/.