American Cities With the Most Mechanically-Inclined Workers in 2023
As concerns over climate change continue to grow, there has been a sustained effort towards electrification, or the process of replacing technologies that use fossil fuels (including coal, oil, and natural gas) with technologies that use electricity for energy. States like California approved the Advanced Clear Cars II rule, which aims to phase out the purchase of new gas cars by 2035 and increase sales and utilization of zero-emissions vehicles. Meanwhile, major companies are also aiming to reduce their carbon footprints by transitioning to green technology, consuming renewable energy, and investing in carbon offsets among other solutions.
While initiatives like these are designed to help the environment, the electrification movement is putting many traditional mechanical occupations at risk. California alone projects nearly 32,000 auto mechanics jobs will be lost throughout the Golden State by 2040, in part because electric vehicles require less maintenance and repair than traditional cars.
RELATED
Many of the most mechanically-inclined occupations also suffer from high rates of workplace injuries. For businesses that employ these workers, make sure to have a strong workers’ compensation insurance policy.
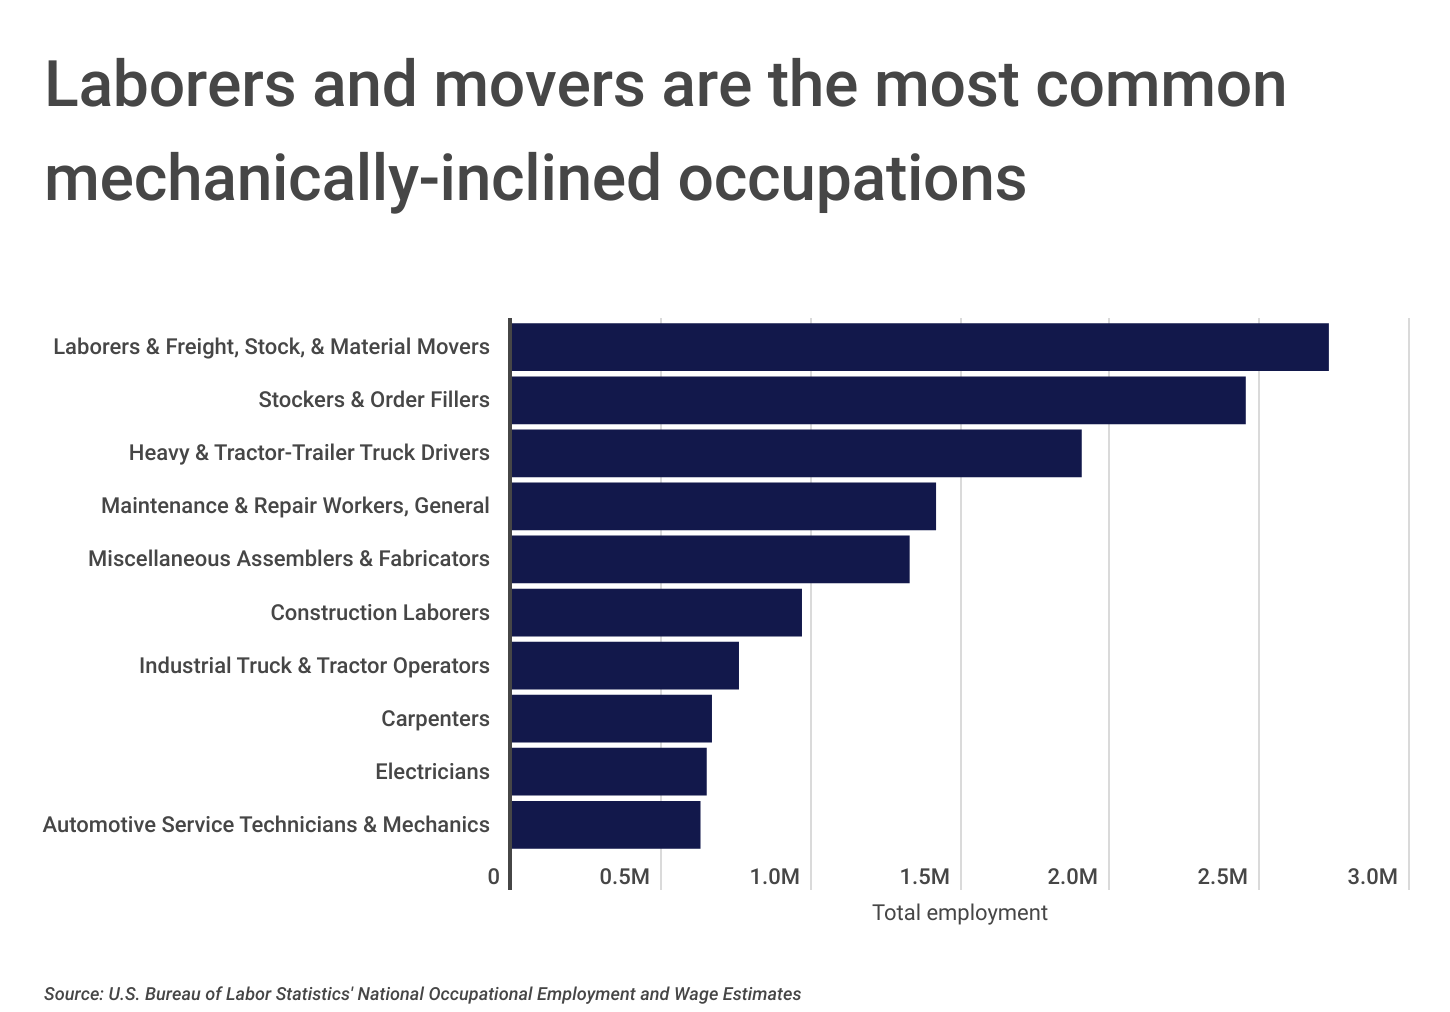
Over 600,000 Americans make a living as automotive service technicians and mechanics, but this occupation makes up just a fraction of mechanically-inclined jobs in the U.S.
Laborers and movers, or workers who manually move freight, stock, luggage or other materials, are the most common mechanically-inclined occupation. A staggering 2.7 million Americans are employed as laborers and movers in the U.S. The second most common mechanically-inclined occupation is made up of stockers and order fillers, employing nearly 2.5 million Americans. Stockers and order fillers receive, store and issue merchandise, materials, equipment, and other items from a stockroom, warehouse, or storage yard to fill shelves, racks, tables or customers’ orders. While these occupations may face other headwinds from robotics and artificial intelligence, they tend to be less affected by the transition to electrification.
RELATED
Skilled workers, such as electricians, carpenters, and other construction laborers who possess mechanical expertise, routinely work on property owned by third parties. Such activities pose a potential liability threat to the employing business. To minimize these risks, businesses can opt for two insurance policies, namely contractor liability insurance and errors and omissions insurance. These policies can help protect businesses and their workers in the event of an accident or mistake on the job.
Although electrification will inevitably eliminate the demand for certain traditional positions, it’s also creating new opportunities, changing the landscape for mechanically-inclined occupations.
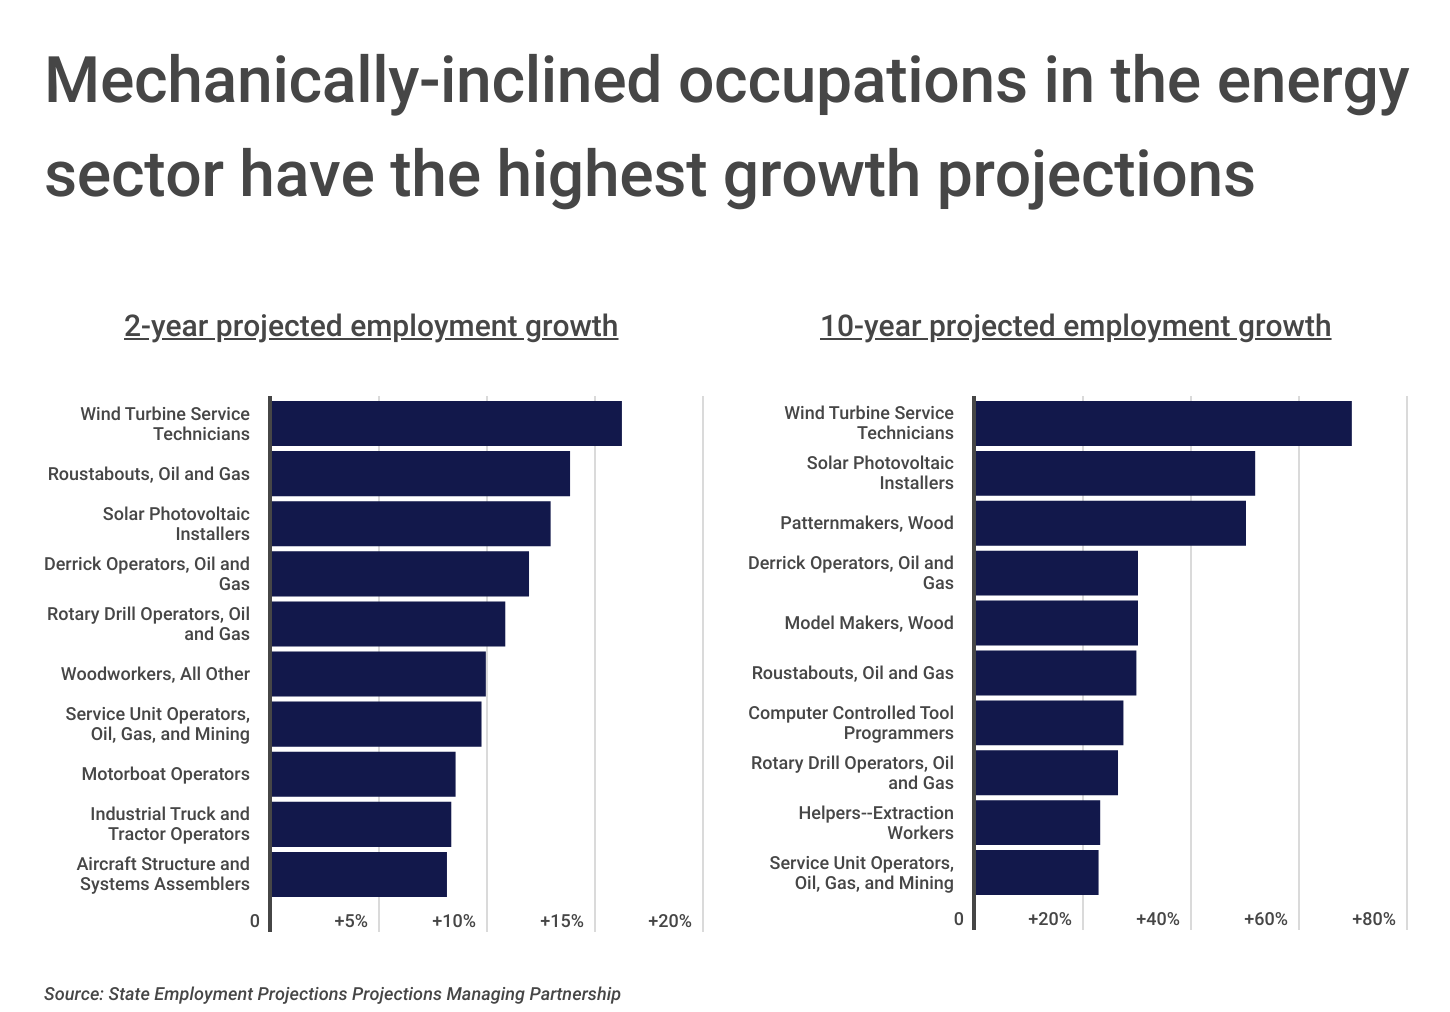
Mechanically-inclined occupations in the energy sector have the highest growth projections compared to other mechanically-inclined jobs, especially when it comes to long-term growth. Wind turbine service technician positions, with job descriptions that include installing, maintaining, and repairing wind turbines, are expected to grow the most overall. The two-year projected employment growth for wind turbine service technicians is 16.2%, with a much larger 10-year projected employment growth of 69.6%.
While the oil and gas roustabouts occupation—\which has a primary responsibility of assembling or repairing oil field equipment using hand and power tools—has the second largest short-term projected growth at 13.8%, the occupation falls to sixth when it comes to long-term projections at 29.7%. Comparatively, solar photovoltaic installers, or individuals responsible for assembling, setting up, and maintaining solar rooftop systems, have a smaller short-term growth projection at 12.9%, but a significantly larger 10-year growth projection of 51.7%.
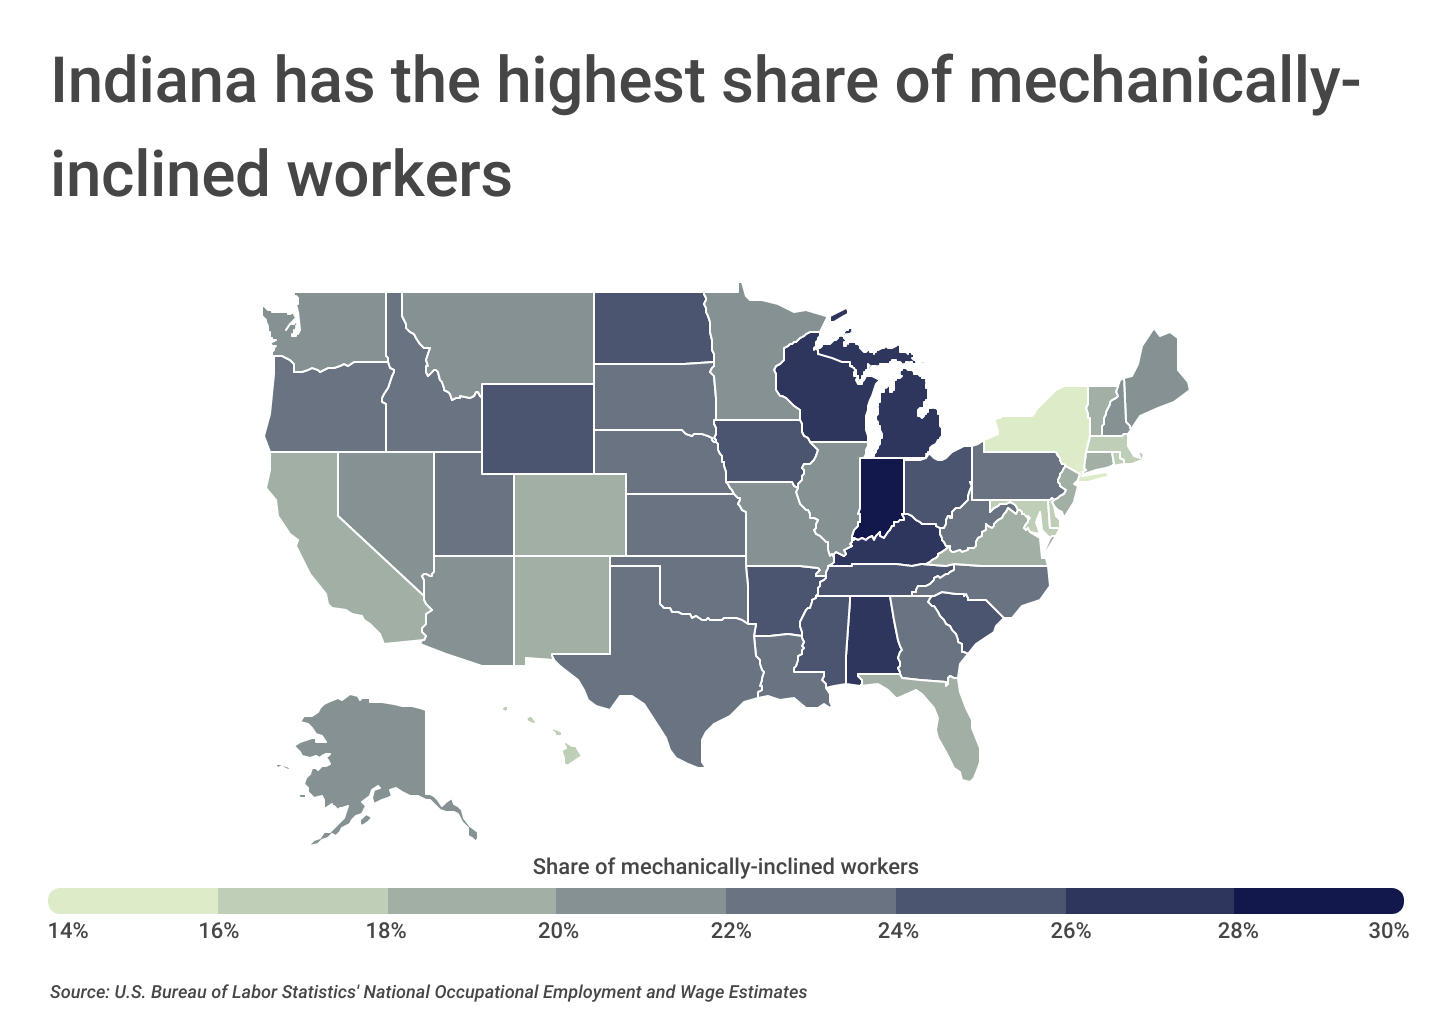
The landscape for mechanically-inclined workers fluctuates regionally, with Midwest states employing the largest shares of mechanically-inclined workers, and Northeast states generally employing the fewest. Indiana employs the largest percentage at 30.1%, followed by Alabama and Kentucky at 27.3% and 27.2%, respectively. Comparatively, the states employing the fewest mechanically-inclined workers are Massachusetts, Delaware, and New York at 16.3%, 16.0%, and 15.4%, respectively. Local economies also play a major role in the employment of mechanical occupations, which may explain why the top U.S. metros with the most mechanically-inclined workers are not restricted to a single region and include cities in the Midwest, West, and South.
The data used in this analysis is from the U.S. Bureau of Labor Statistics Occupational Employment and Wage Statistics. To determine the locations with the most mechanically-inclined workers, researchers at Construction Coverage calculated the share of
mechanically-inclined workers out of all workers. In the event of a tie, the location with the higher concentration of mechanically-inclined workers as compared to the national average was ranked higher. For the purpose of this analysis, mechanically-inclined workers are defined as workers in one of 269 occupations where a mechanical inclination is necessary as part of regular work activities.
Here are the U.S. metropolitan areas with the most mechanically-inclined workers.
Large Metros With the Most Mechanically-Inclined Workers

Photo Credit: CK Foto / Shutterstock
15. Dallas-Fort Worth-Arlington, TX
- Share of mechanically-inclined workers: 22.1%
- Concentration of mechanically-inclined workers (compared to average): +2.8%
- Total mechanically-inclined workers: 794,870
- Average wage for mechanically-inclined workers: $49,161
- Most common mechanically-inclined occupation: Stockers and Order Fillers

Photo Credit: Sean Pavone / Shutterstock
14. Birmingham-Hoover, AL
- Share of mechanically-inclined workers: 22.2%
- Concentration of mechanically-inclined workers (compared to average): +3.3%
- Total mechanically-inclined workers: 107,300
- Average wage for mechanically-inclined workers: $45,668
- Most common mechanically-inclined occupation: Laborers and Freight, Stock, and Material Movers, Hand

Photo Credit: ESB Professional / Shutterstock
13. Portland-Vancouver-Hillsboro, OR-WA
- Share of mechanically-inclined workers: 22.6%
- Concentration of mechanically-inclined workers (compared to average): +5.1%
- Total mechanically-inclined workers: 253,720
- Average wage for mechanically-inclined workers: $57,777
- Most common mechanically-inclined occupation: Stockers and Order Fillers

Photo Credit: Jon Bilous / Shutterstock
12. Charlotte-Concord-Gastonia, NC-SC
- Share of mechanically-inclined workers: 23.2%
- Concentration of mechanically-inclined workers (compared to average): +7.9%
- Total mechanically-inclined workers: 280,660
- Average wage for mechanically-inclined workers: $46,577
- Most common mechanically-inclined occupation: Laborers and Freight, Stock, and Material Movers, Hand

Photo Credit: Sean Pavone / Shutterstock
11. Nashville-Davidson–Murfreesboro–Franklin, TN
- Share of mechanically-inclined workers: 23.3%
- Concentration of mechanically-inclined workers (compared to average): +8.4%
- Total mechanically-inclined workers: 227,990
- Average wage for mechanically-inclined workers: $44,791
- Most common mechanically-inclined occupation: Stockers and Order Fillers

Photo Credit: travelview / Shutterstock
10. Houston-The Woodlands-Sugar Land, TX
- Share of mechanically-inclined workers: 23.4%
- Concentration of mechanically-inclined workers (compared to average): +8.8%
- Total mechanically-inclined workers: 677,640
- Average wage for mechanically-inclined workers: $54,298
- Most common mechanically-inclined occupation: Laborers and Freight, Stock, and Material Movers, Hand

Photo Credit: f11photo / Shutterstock
9. Milwaukee-Waukesha, WI
- Share of mechanically-inclined workers: 23.5%
- Concentration of mechanically-inclined workers (compared to average): +9.3%
- Total mechanically-inclined workers: 184,710
- Average wage for mechanically-inclined workers: $50,265
- Most common mechanically-inclined occupation: Laborers and Freight, Stock, and Material Movers, Hand

Photo Credit: Rosamar / Shutterstock
8. Cincinnati, OH-KY-IN
- Share of mechanically-inclined workers: 23.9%
- Concentration of mechanically-inclined workers (compared to average): +11.2%
- Total mechanically-inclined workers: 244,880
- Average wage for mechanically-inclined workers: $48,160
- Most common mechanically-inclined occupation: Laborers and Freight, Stock, and Material Movers, Hand
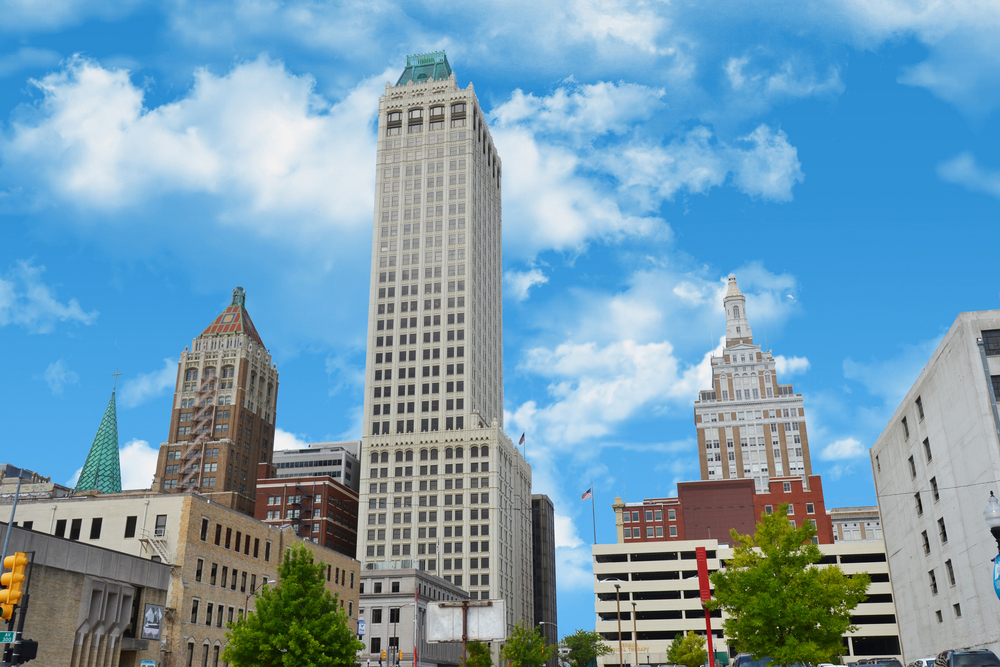
Photo Credit: Valiik30 / Shutterstock
7. Tulsa, OK
- Share of mechanically-inclined workers: 25.0%
- Concentration of mechanically-inclined workers (compared to average): +16.3%
- Total mechanically-inclined workers: 104,580
- Average wage for mechanically-inclined workers: $48,733
- Most common mechanically-inclined occupation: Stockers and Order Fillers

Photo Credit: Agnieszka Gaul / Shutterstock
6. Indianapolis-Carmel-Anderson, IN
- Share of mechanically-inclined workers: 25.1%
- Concentration of mechanically-inclined workers (compared to average): +16.7%
- Total mechanically-inclined workers: 253,270
- Average wage for mechanically-inclined workers: $46,611
- Most common mechanically-inclined occupation: Laborers and Freight, Stock, and Material Movers, Hand

Photo Credit: Sean Pavone / Shutterstock
5. Memphis, TN-MS-AR
- Share of mechanically-inclined workers: 26.8%
- Concentration of mechanically-inclined workers (compared to average): +24.7%
- Total mechanically-inclined workers: 162,180
- Average wage for mechanically-inclined workers: $43,271
- Most common mechanically-inclined occupation: Laborers and Freight, Stock, and Material Movers, Hand
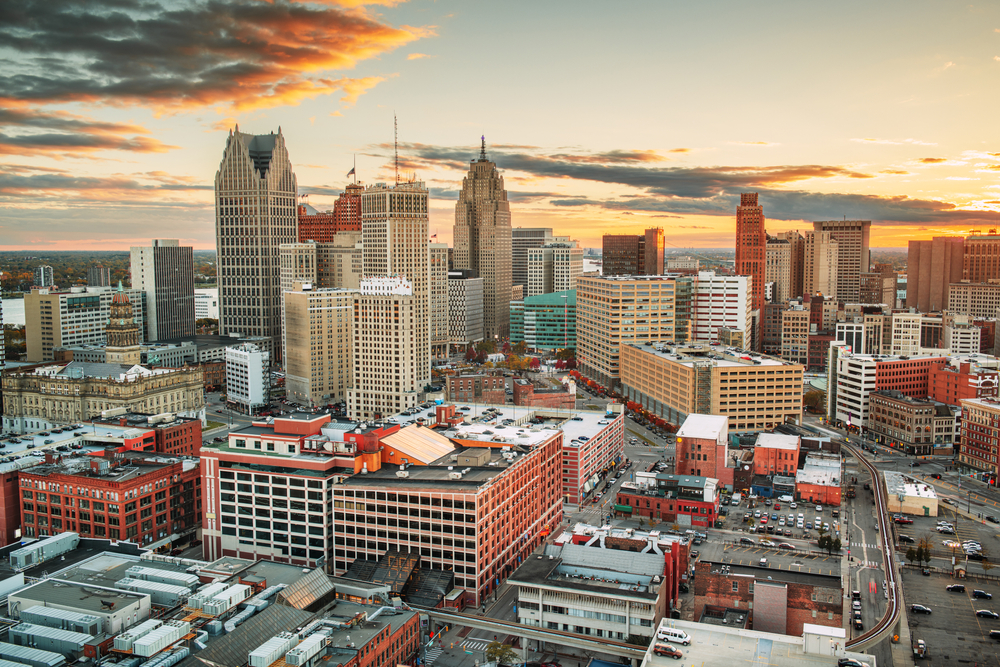
Photo Credit: Sean Pavone / Shutterstock
4. Detroit-Warren-Dearborn, MI
- Share of mechanically-inclined workers: 27.0%
- Concentration of mechanically-inclined workers (compared to average): +25.6%
- Total mechanically-inclined workers: 485,600
- Average wage for mechanically-inclined workers: $53,932
- Most common mechanically-inclined occupation: Miscellaneous Assemblers and Fabricators

Photo Credit: Hendrickson Photography / Shutterstock
3. Louisville/Jefferson County, KY-IN
- Share of mechanically-inclined workers: 27.8%
- Concentration of mechanically-inclined workers (compared to average): +29.3%
- Total mechanically-inclined workers: 173,670
- Average wage for mechanically-inclined workers: $45,563
- Most common mechanically-inclined occupation: Laborers and Freight, Stock, and Material Movers, Hand
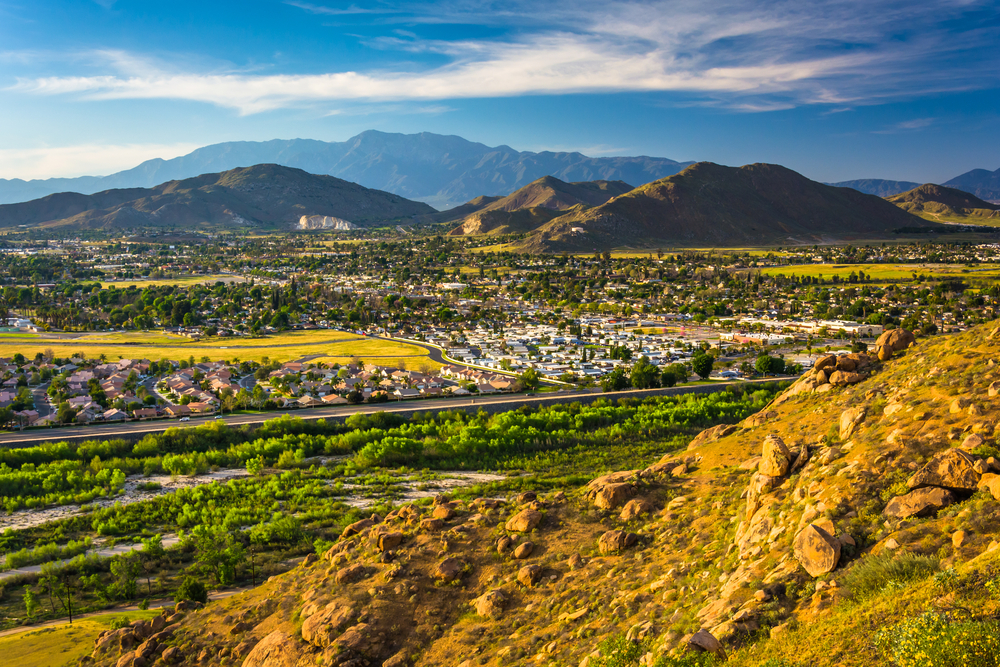
Photo Credit: Jon Bilous / Shutterstock
2. Riverside-San Bernardino-Ontario, CA
- Share of mechanically-inclined workers: 28.2%
- Concentration of mechanically-inclined workers (compared to average): +31.2%
- Total mechanically-inclined workers: 431,970
- Average wage for mechanically-inclined workers: $48,464
- Most common mechanically-inclined occupation: Laborers and Freight, Stock, and Material Movers, Hand

Photo Credit: Sean Pavone / Shutterstock
1. Grand Rapids-Kentwood, MI
- Share of mechanically-inclined workers: 30.2%
- Concentration of mechanically-inclined workers (compared to average): +40.5%
- Total mechanically-inclined workers: 153,340
- Average wage for mechanically-inclined workers: $45,775
- Most common mechanically-inclined occupation: Miscellaneous Assemblers and Fabricators
Detailed Findings & Methodology
The data used in this analysis is from the U.S. Bureau of Labor Statistics’ Occupational Employment and Wage Statistics program. To determine the locations with the most mechanically-inclined workers, researchers at Construction Coverage calculated the share of
mechanically-inclined workers out of all workers. In the event of a tie, the location with the higher concentration of mechanically-inclined workers as compared to the national average was ranked higher. For the purpose of this analysis, mechanically-inclined workers are defined as workers in one of 269 occupations where a mechanical inclination is necessary as part of regular work activities. Occupations were omitted in calculations for locations where there was no employment in those specific occupations. To improve relevance, only metropolitan areas with at least 100,000 residents were included, and metros were grouped into cohorts based on population size: small (100,000-349,999), midsize (350,000-999,999), and large (1,000,000 or more).
Each company featured in our guides has been independently selected and reviewed by our research team. If you select one of these companies and click on a link, we may earn a commission.
By clicking on these links, you may be taken to one of our insurance partners. The specific company listed here may or may not be included in our partner’s network at this time.