The Most Stable U.S. Housing Markets [2023 Edition]
The red-hot pandemic housing market has finally cooled in recent months. Due to actions by the Federal Reserve to combat inflation, mortgage rates have more than doubled from the historic lows seen in 2021. As a result, home sales have slowed dramatically, and prices have started to come down. However, housing markets in some parts of the country tend to be less stable and more prone to volatility than others.
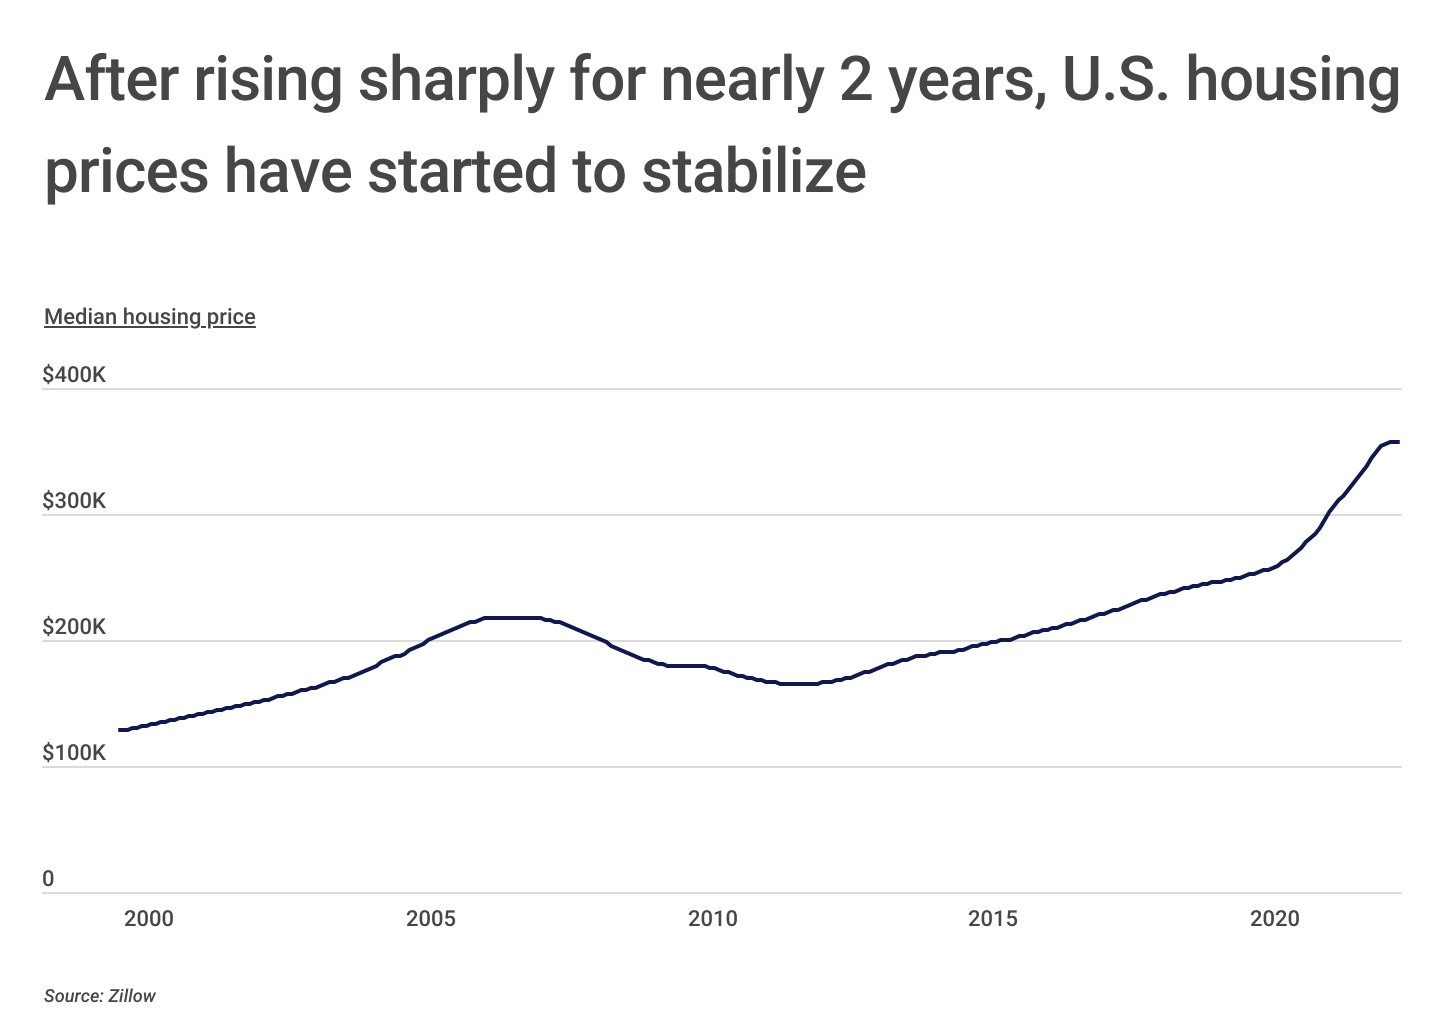
Before the recent drop, the median price of housing in the U.S. had been rising almost steadily since 2012, when prices bottomed out in the wake of the Great Recession and housing crisis of 2008. Home prices started rising more rapidly in the second half of 2020 due to a combination of factors—including increased housing demand, a limited supply of new homes, and expectations about future home prices.
In March 2022, the Federal Reserve began a series of interest rate hikes in an effort to tamp down inflation, and by summer, the median price of housing had begun to stabilize. However, high interest rates have made buying a home a more expensive undertaking, especially in cities where home prices increased the most during the last few years. As potential buyers weigh their options in this market, it is helpful to consider how different locations have fared historically during periods of volatility.
RELATED
In recent years, with the steep rise in home prices, there has been a significant surge in home renovations and remodels. However, it is crucial for homeowners to be adequately protected by a builders risk insurance policy when undertaking any significant construction project. Typically, it is the general contractor who purchases the policy, but many insurance companies also offer builders risk insurance for homeowners that want to secure the policy directly.
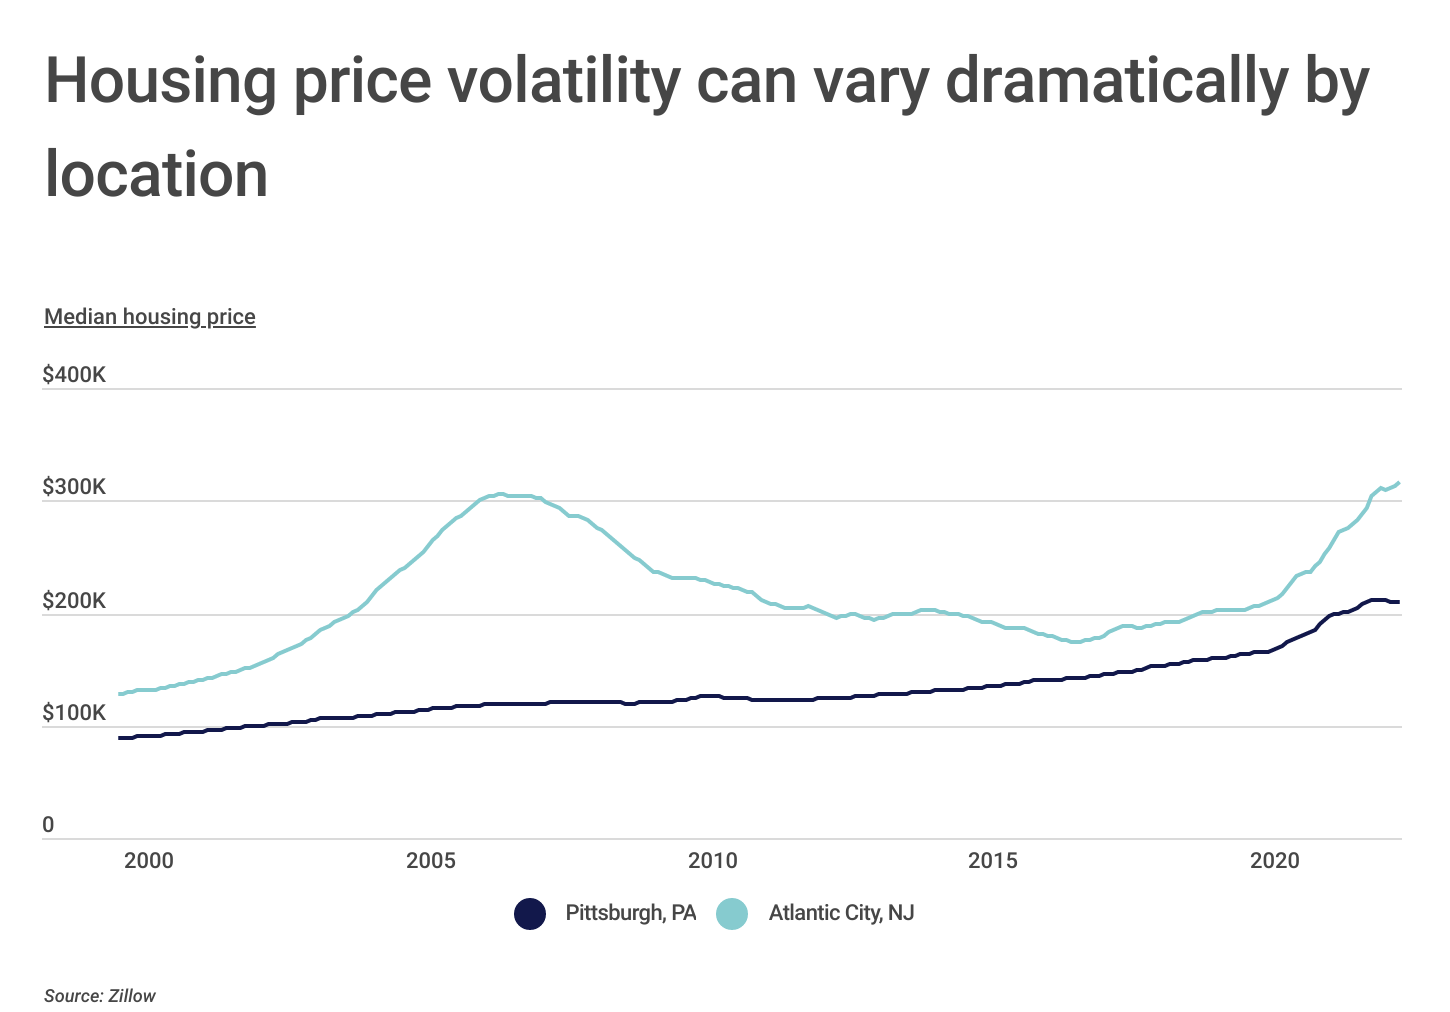
Housing markets in some cities are especially prone to price fluctuations. Atlantic City is one such housing market that has proven to be more volatile than others. The median price of housing in Atlantic City reached over $300,000 in 2007 before it came crashing down, hitting a low of $174,544 in 2017. Home prices then began to rebound and increased sharply over the last two years. In comparison, the Pittsburgh housing market has been much more stable. Pittsburgh home prices stayed relatively flat during the housing crisis and ensuing recession in 2008, and the increase in home prices since the pandemic has been more muted than in many other parts of the U.S.
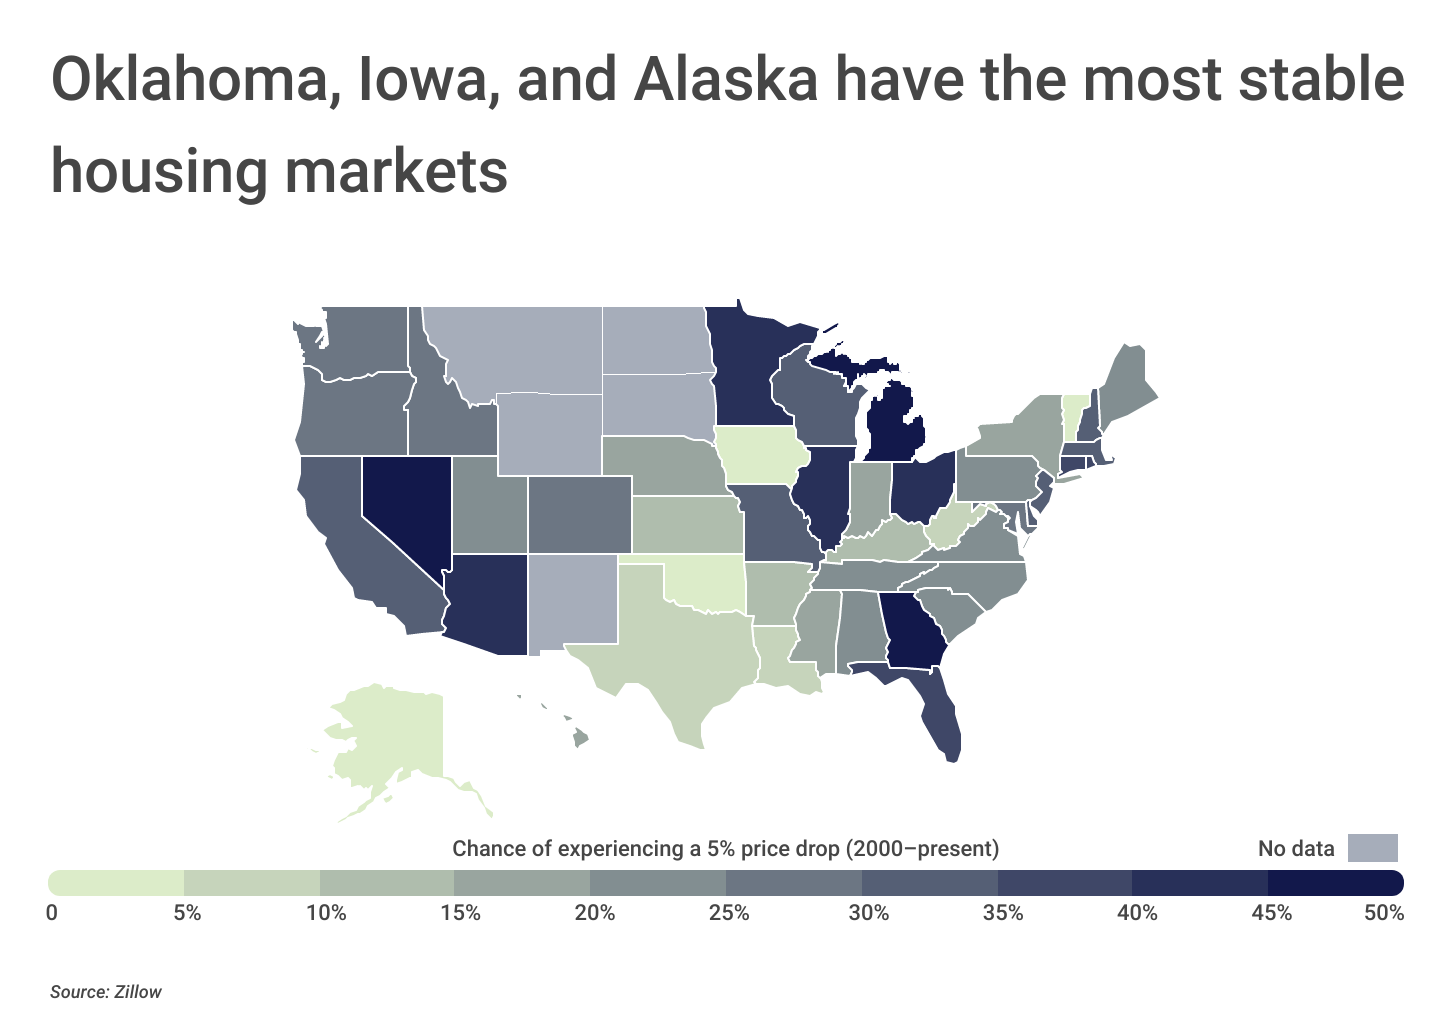
At the state level, Oklahoma, Iowa, and Alaska have the most stable housing markets, as measured by the probability that a buyer purchasing a home at any point between 2000 and present would have experienced a greater-than-5% price drop following the purchase. All three of these states had a 0% chance of this happening. In contrast, the probability of experiencing at least a 5% price drop between 2000 and present was 50.2% in Nevada and 49.8% in Georgia.
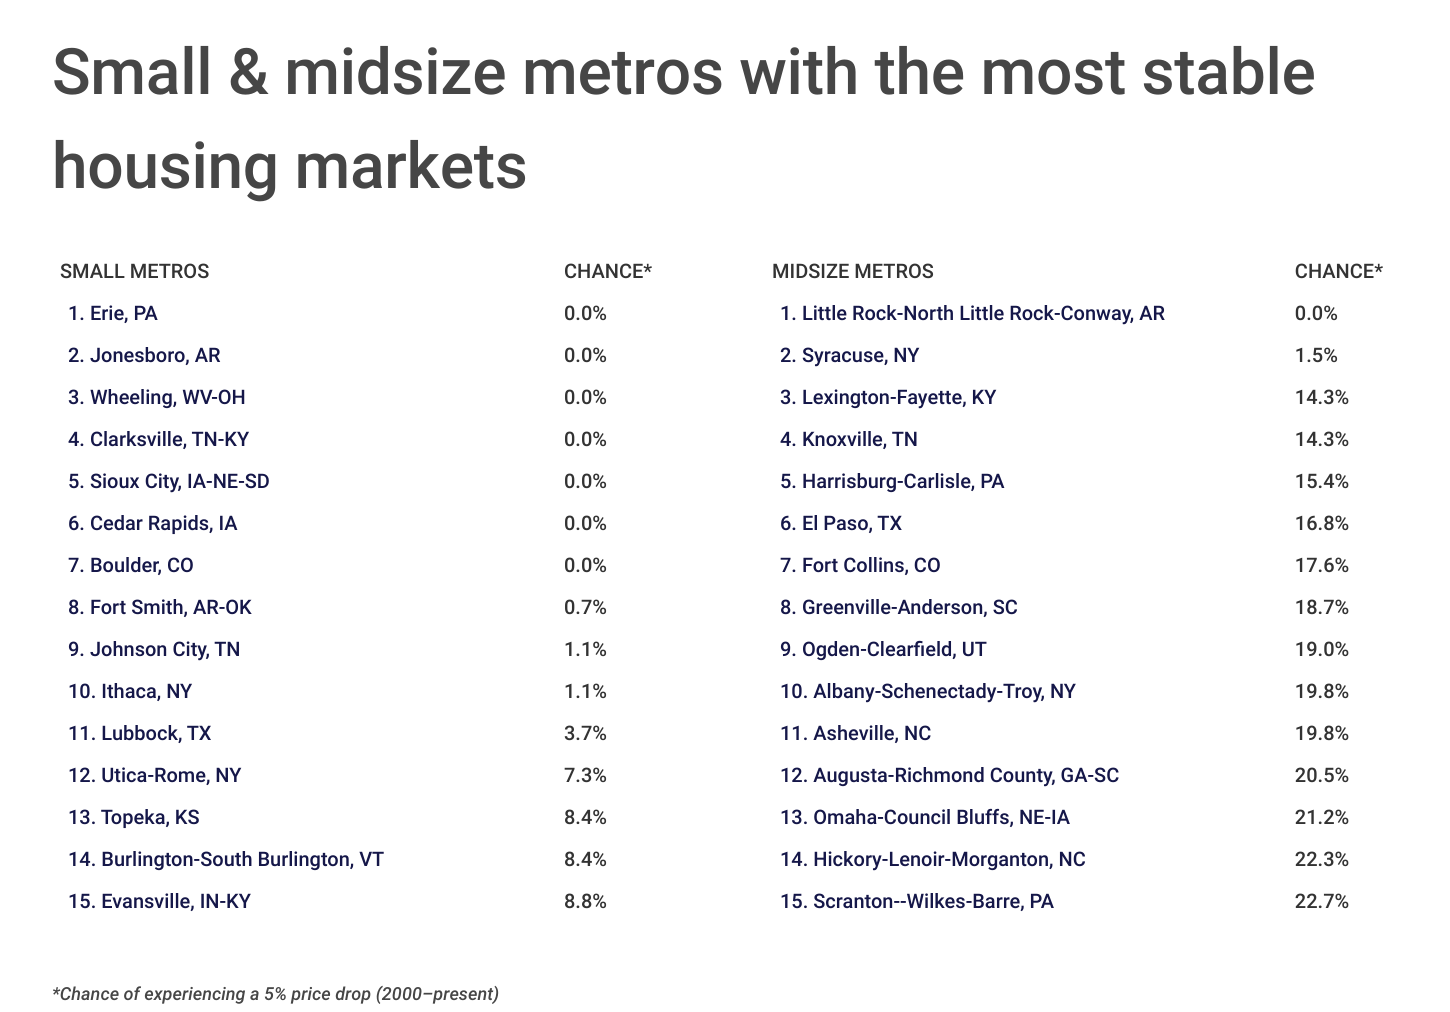
To determine the locations with the most stable housing markets, researchers at Construction Coverage analyzed the latest data from Zillow. The researchers ranked metros according to the chance of a random buyer experiencing at least a 5% price drop, using data from 2000 to present. For each location, researchers also calculated the largest price drop from 2000 to present, the current median home price, and the percentage change in home price from 2000 to present.
Here are the U.S. metropolitan areas with the most stable housing markets.
Large Metros With the Most Stable Housing Markets
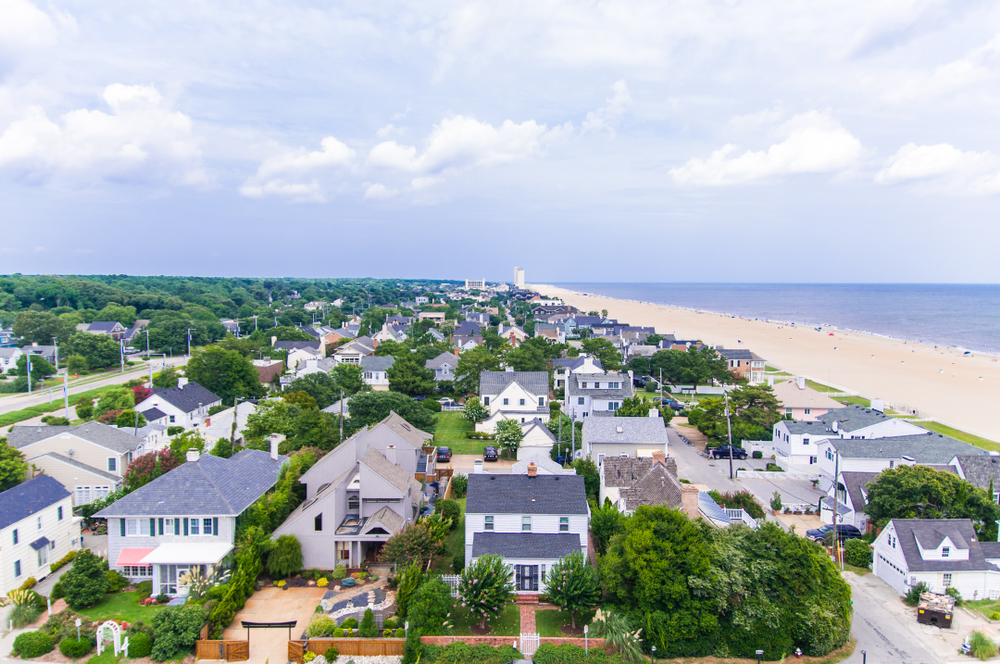
Photo Credit: John S. Quinn / Shutterstock
15. Virginia Beach-Norfolk-Newport News, VA-NC
- Chance of experiencing a 5% price drop (2000-present): 24.2%
- Largest price drop (2000-present): $49,198
- Median home price (present): $334,319
- Percentage change in home price (2000-present): 171%

Photo Credit: Hendrickson Photography / Shutterstock
14. Louisville/Jefferson County, KY-IN
- Chance of experiencing a 5% price drop (2000-present): 22.7%
- Largest price drop (2000-present): $12,831
- Median home price (present): $243,782
- Percentage change in home price (2000-present): 116%

Photo Credit: Farid Sani / Shutterstock
13. Raleigh-Cary, NC
- Chance of experiencing a 5% price drop (2000-present): 21.2%
- Largest price drop (2000-present): $30,661
- Median home price (present): $448,553
- Percentage change in home price (2000-present): 156%

Photo Credit: Sean Pavone / Shutterstock
12. New Orleans-Metairie, LA
- Chance of experiencing a 5% price drop (2000-present): 21.2%
- Largest price drop (2000-present): $26,049
- Median home price (present): $270,020
- Percentage change in home price (2000-present): 121%

Photo Credit: photo.ua / Shutterstock
11. Salt Lake City, UT
- Chance of experiencing a 5% price drop (2000-present): 20.9%
- Largest price drop (2000-present): $78,455
- Median home price (present): $582,222
- Percentage change in home price (2000-present): 212%

Photo Credit: Steve Heap / Shutterstock
10. Nashville-Davidson–Murfreesboro–Franklin, TN
- Chance of experiencing a 5% price drop (2000-present): 20.9%
- Largest price drop (2000-present): $26,081
- Median home price (present): $452,985
- Percentage change in home price (2000-present): 215%

Photo Credit: ESB Professional / Shutterstock
9. Washington-Arlington-Alexandria, DC-VA-MD-WV
- Chance of experiencing a 5% price drop (2000-present): 19.8%
- Largest price drop (2000-present): $135,255
- Median home price (present): $550,214
- Percentage change in home price (2000-present): 188%

Photo Credit: nektofadeev / Shutterstock
8. Houston-The Woodlands-Sugar Land, TX
- Chance of experiencing a 5% price drop (2000-present): 19.4%
- Largest price drop (2000-present): $16,123
- Median home price (present): $314,051
- Percentage change in home price (2000-present): 149%

Photo Credit: Izabela23 / Shutterstock
7. Urban Honolulu, HI
- Chance of experiencing a 5% price drop (2000-present): 16.1%
- Largest price drop (2000-present): $97,356
- Median home price (present): $928,450
- Percentage change in home price (2000-present): 271%

Photo Credit: Valiik30 / Shutterstock
6. Tulsa, OK
- Chance of experiencing a 5% price drop (2000-present): 15.0%
- Largest price drop (2000-present): $9,399
- Median home price (present): $217,564
- Percentage change in home price (2000-present): 115%

Photo Credit: f11photo / Shutterstock
5. San Antonio-New Braunfels, TX
- Chance of experiencing a 5% price drop (2000-present): 11.0%
- Largest price drop (2000-present): $15,889
- Median home price (present): $340,353
- Percentage change in home price (2000-present): 160%

Photo Credit: Ryan Conine / Shutterstock
4. Austin-Round Rock-Georgetown, TX
- Chance of experiencing a 5% price drop (2000-present): 10.3%
- Largest price drop (2000-present): $38,559
- Median home price (present): $549,232
- Percentage change in home price (2000-present): 210%

Photo Credit: Henryk Sadura / Shutterstock
3. Oklahoma City, OK
- Chance of experiencing a 5% price drop (2000-present): 0.0%
- Largest price drop (2000-present): $5,304
- Median home price (present): $222,360
- Percentage change in home price (2000-present): 143%

Photo Credit: Open.Tours LLC / Shutterstock
2. Buffalo-Cheektowaga, NY
- Chance of experiencing a 5% price drop (2000-present): 0.0%
- Largest price drop (2000-present): $4,535
- Median home price (present): $244,001
- Percentage change in home price (2000-present): 163%

Photo Credit: AevanStock / Shutterstock
1. Pittsburgh, PA
- Chance of experiencing a 5% price drop (2000-present): 0.0%
- Largest price drop (2000-present): $3,892
- Median home price (present): $209,084
- Percentage change in home price (2000-present): 136%
Detailed Findings & Methodology
To determine the U.S. metropolitan areas with the most stable housing markets, researchers at Construction Coverage analyzed the latest data from Zillows’ Zillow Home Value Index (ZHVI), a measure of typical home value. The researchers ranked metros according to the probability that a random buyer purchasing a home at any point between 2000 and present would have experienced a greater-than-5% price drop following the purchase. In the event of a tie, the metro with the largest price drop from 2000 to present was ranked higher. Researchers also calculated the current median home price—using the most recent ZHVI—and the percentage change in home price from 2000 to present. Metros missing three or more consecutive months of ZHVI data were excluded from the analysis. For metros missing one or two consecutive months of data, missing values were imputed using an average of the ZHVI for the months immediately before and after.
To improve relevance, only metropolitan areas with at least 100,000 people were included in the analysis. Additionally, metro areas were grouped into the following cohorts based on population size:
- Small metros: 100,000-349,999
- Midsize metros: 350,000-999,999
- Large metros: more than 1,000,000
Each company featured in our guides has been independently selected and reviewed by our research team. If you select one of these companies and click on a link, we may earn a commission.
By clicking on these links, you may be taken to one of our insurance partners. The specific company listed here may or may not be included in our partner’s network at this time.
