Cities With the Most Physically Demanding Jobs
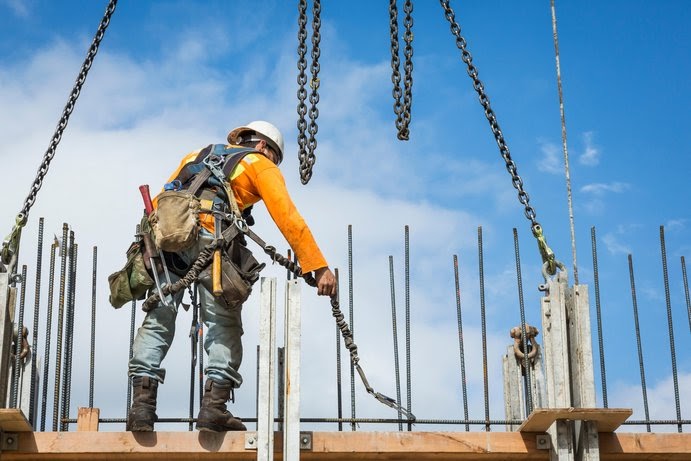
The COVID-19 pandemic is responsible for the largest wave of job losses since the Great Depression. The mass layoffs caused by social distancing regulations have brought new meaning to the term “essential worker.” Today’s essential workers often hold some of the most physically demanding jobs. According to data from the Bureau of Labor Statistics, more than one-third of workers in protective service, construction, maintenance, and repair engage in physically demanding activity.
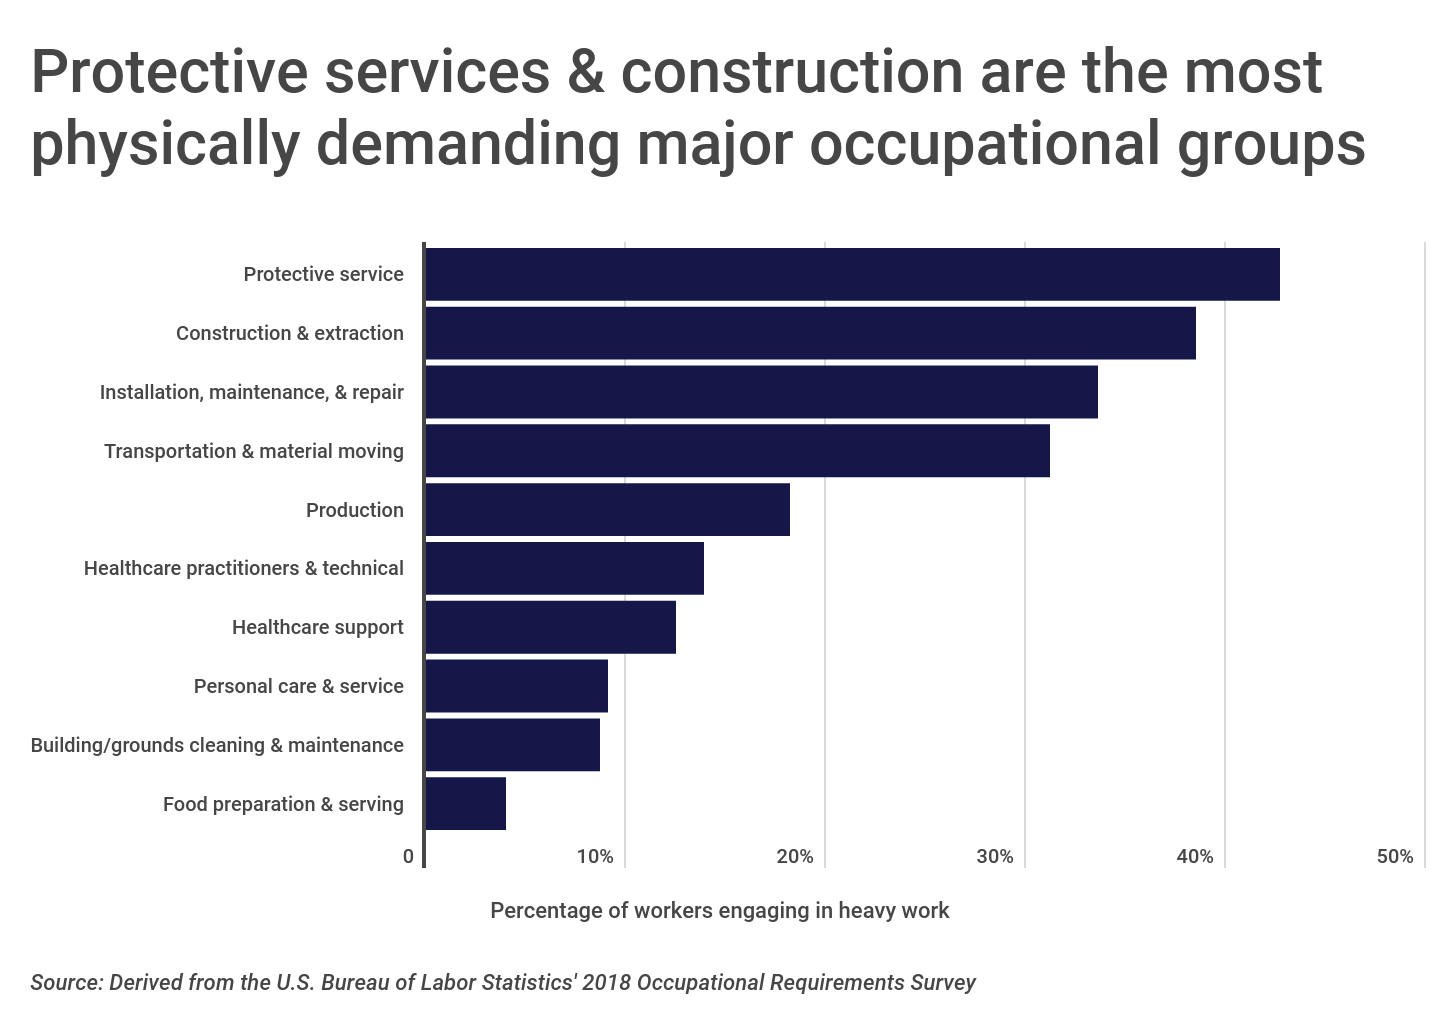
Nationally, over 10 percent of all workers hold physically demanding jobs, defined here as jobs where workers engage in heavy or very heavy work activities. A large portion of those physically demanding jobs are in transportation and material moving, which employs over 12.5 million workers in the U.S. Construction occupations also account for a significant number of workers in physically demanding roles, with nearly 2.3 million construction workers engaging in heavy or very heavy work.
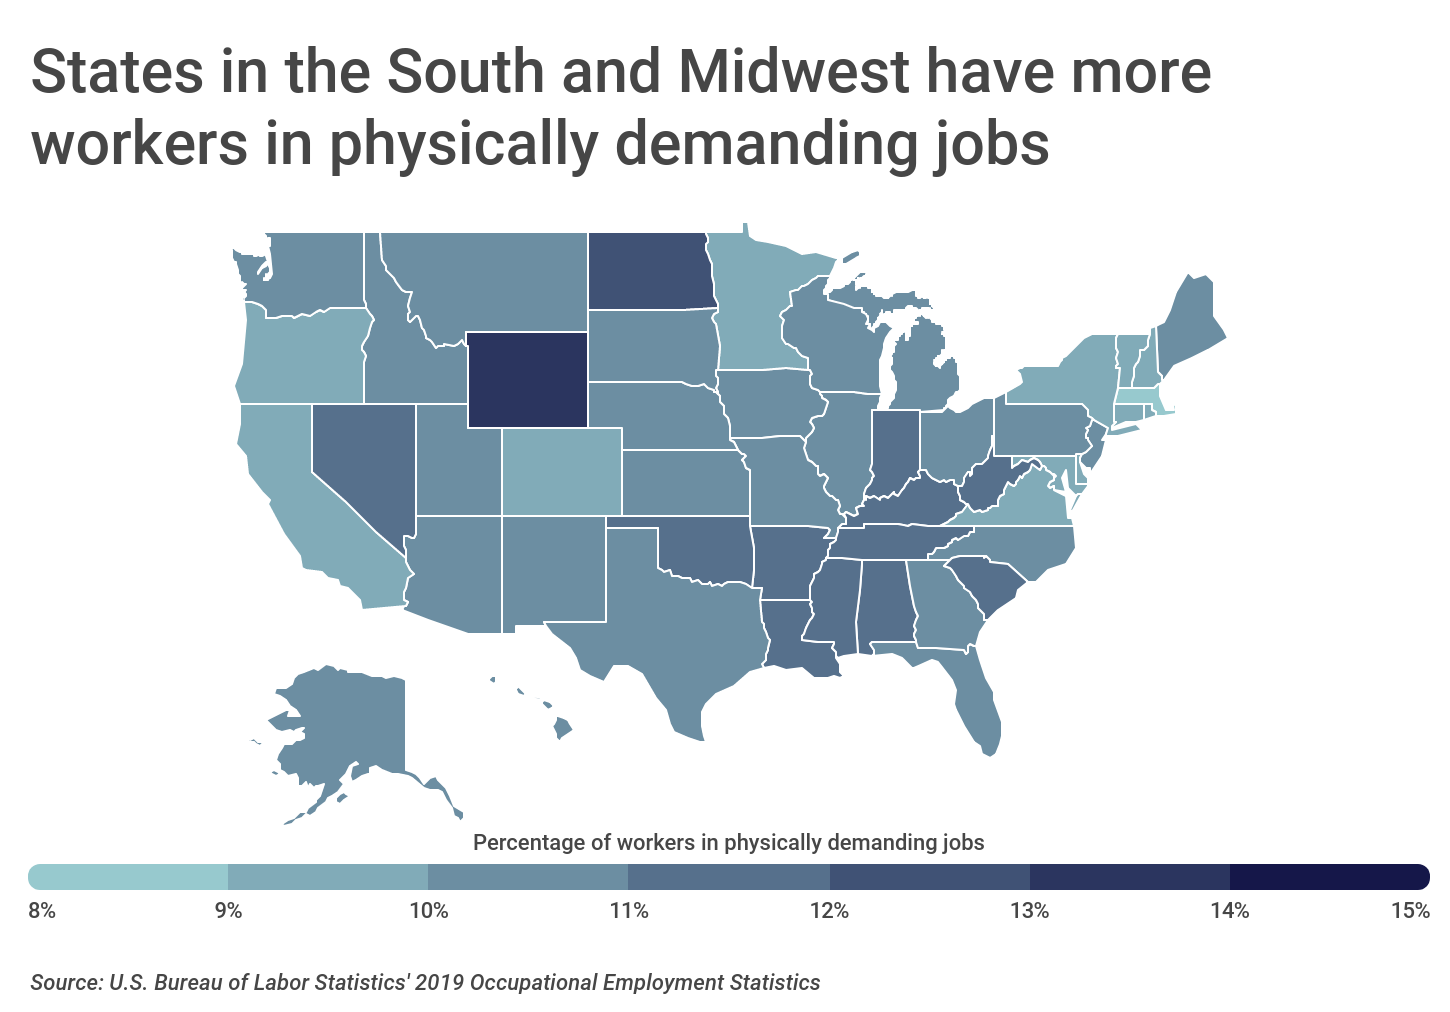
At the state level, the largest share of workers in physically demanding jobs are found in Midwestern states such as North Dakota (12.4 percent of total jobs) and Southern states like Mississippi (11.9 percent of total jobs). Conversely, the lowest share of workers in physically demanding jobs are found in Northeastern states such as Massachusetts (8.8 percent of total jobs) and Connecticut (9.1 percent of total jobs).
TRENDING
Do you employ workers in physically demanding jobs? Make sure you have a policy with one of the best workers’ compensation insurance companies.
To profile cities with the largest percentage of workers in physically demanding jobs, researchers from Construction Coverage, a review website for builders risk insurance and construction project management software, analyzed data from the U.S. Bureau of Labor Statistics. Employment and wage data were derived from 2019 Occupational Employment Statistics, while information on the physical requirements of occupations was taken from the 2018 Occupational Requirements Survey. Physical demand was measured by the strength requirements necessary to perform the duties of a given occupation.
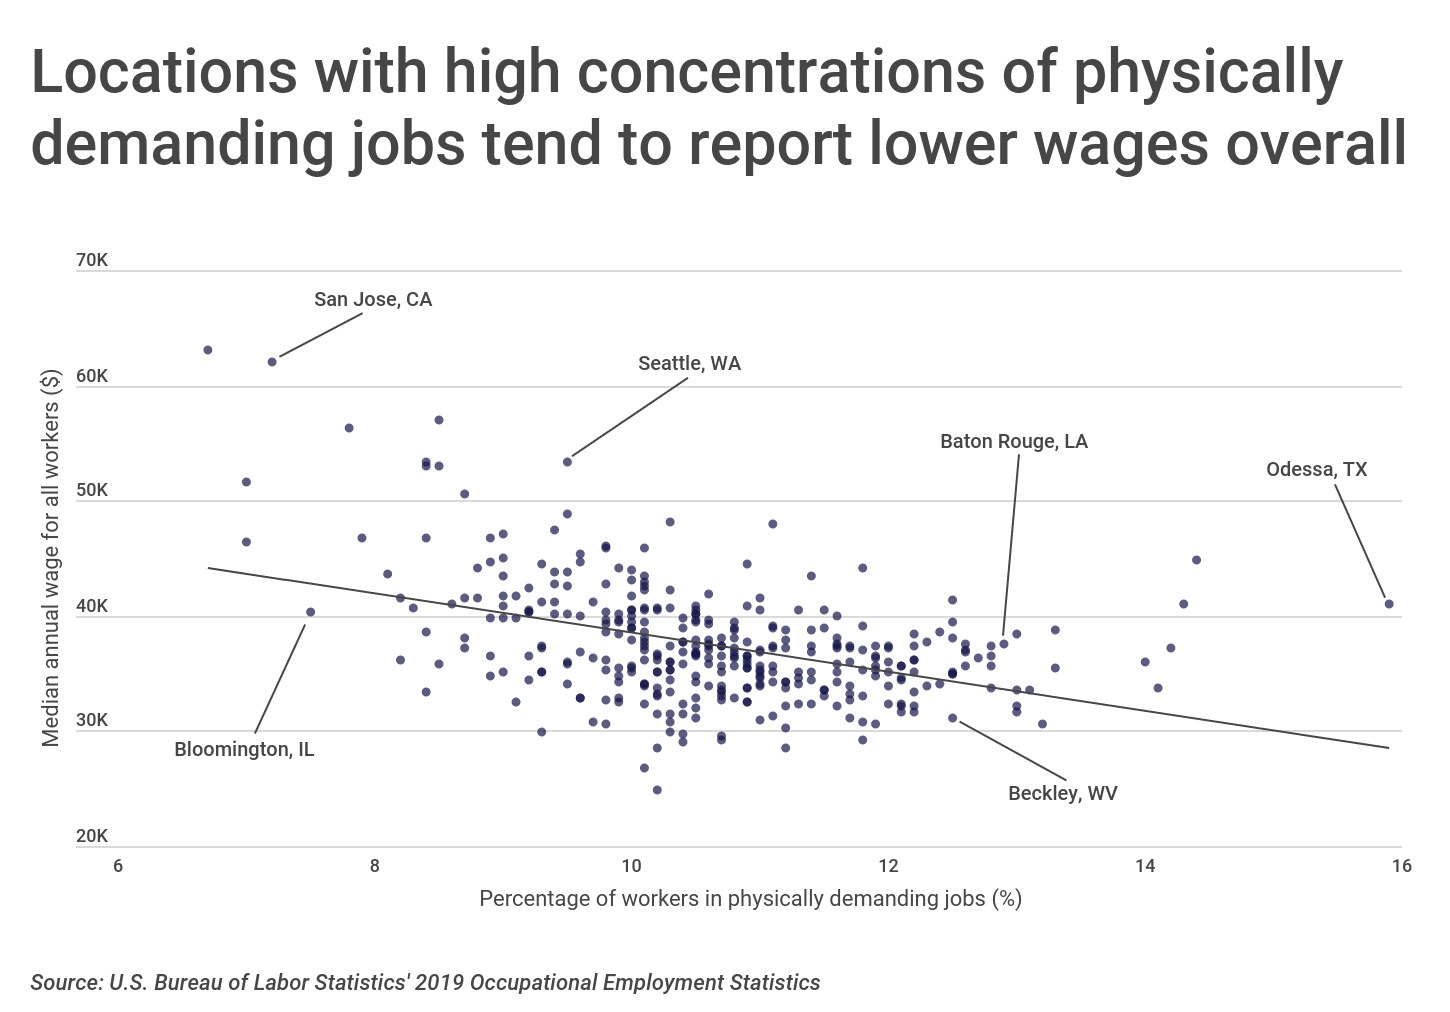
Locations with a greater prevalence of physically demanding jobs tend to have lower overall wages. In locations where more than 10 percent of workers are in physically demanding jobs, the average median annual wage is slightly above $36,000. By comparison, the average median annual wage in locations where less than 10 percent of workers engage in physically demanding jobs is $41,000. Despite this trend, physically demanding jobs often require only a high school diploma or less. Adjusting for educational attainment, workers with physically demanding jobs actually tend to earn more than workers with similar education in different jobs.
Here are the 15 metropolitan areas with the largest percentage of workers in physically demanding jobs.
Large metros with the most physically demanding jobs

Photo Credit: Alamy Stock Photo
15. Oklahoma City, OK
- Percentage of workers in physically demanding jobs: 10.4%
- Total workers in physically demanding jobs: 64,924
- Total workers across all jobs: 627,500
- Protective service workers: 13,310
- Construction workers: 36,090
- Installation, maintenance, & repair workers: 27,240
- Transportation & moving workers: 49,820
- Median annual wage (all workers): $37,640
TRENDING
Do you regularly use your truck for work? It’s important to have a commercial truck insurance policy that covers you when you are on the clock.

Photo Credit: Alamy Stock Photo
14. Nashville-Davidson–Murfreesboro–Franklin, TN
- Percentage of workers in physically demanding jobs: 10.4%
- Total workers in physically demanding jobs: 104,147
- Total workers across all jobs: 999,030
- Protective service workers: 23,010
- Construction workers: 34,390
- Installation, maintenance, & repair workers: 39,690
- Transportation & moving workers: 102,930
- Median annual wage (all workers): $38,900
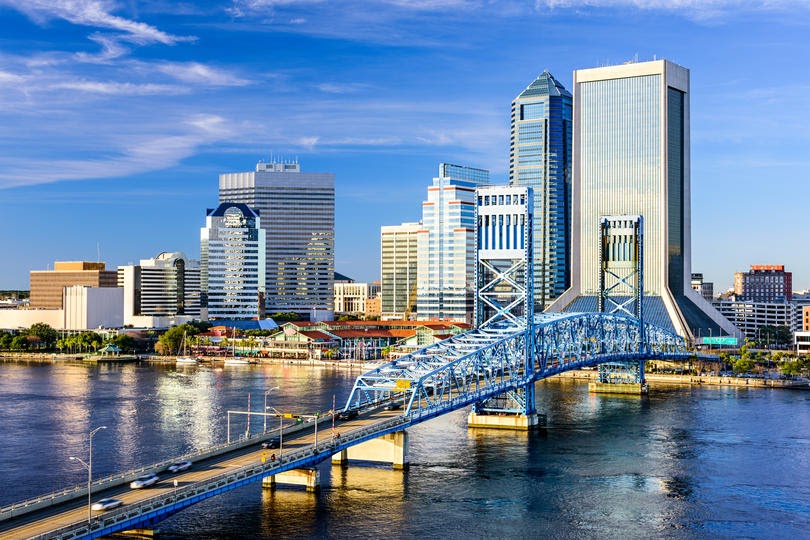
Photo Credit: Alamy Stock Photo
13. Jacksonville, FL
- Percentage of workers in physically demanding jobs: 10.5%
- Total workers in physically demanding jobs: 73,877
- Total workers across all jobs: 703,140
- Protective service workers: 17,530
- Construction workers: 32,850
- Installation, maintenance, & repair workers: 31,340
- Transportation & moving workers: 67,280
- Median annual wage (all workers): $36,770
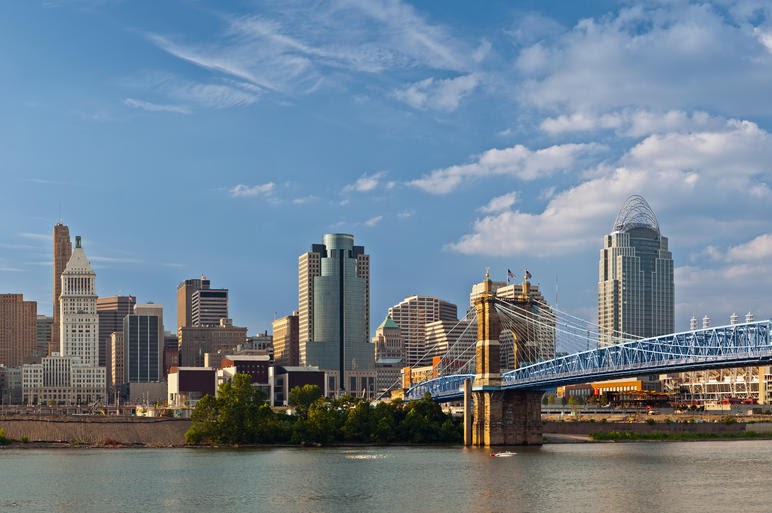
Photo Credit: Alamy Stock Photo
12. Cincinnati, OH-KY-IN
- Percentage of workers in physically demanding jobs: 10.5%
- Total workers in physically demanding jobs: 114,206
- Total workers across all jobs: 1,083,650
- Protective service workers: 22,300
- Construction workers: 36,770
- Installation, maintenance, & repair workers: 43,250
- Transportation & moving workers: 108,510
- Median annual wage (all workers): $39,620

Photo Credit: Alamy Stock Photo
11. Charlotte-Concord-Gastonia, NC-SC
- Percentage of workers in physically demanding jobs: 10.6%
- Total workers in physically demanding jobs: 132,596
- Total workers across all jobs: 1,245,660
- Protective service workers: 27,380
- Construction workers: 55,170
- Installation, maintenance, & repair workers: 51,630
- Transportation & moving workers: 128,790
- Median annual wage (all workers): $39,230
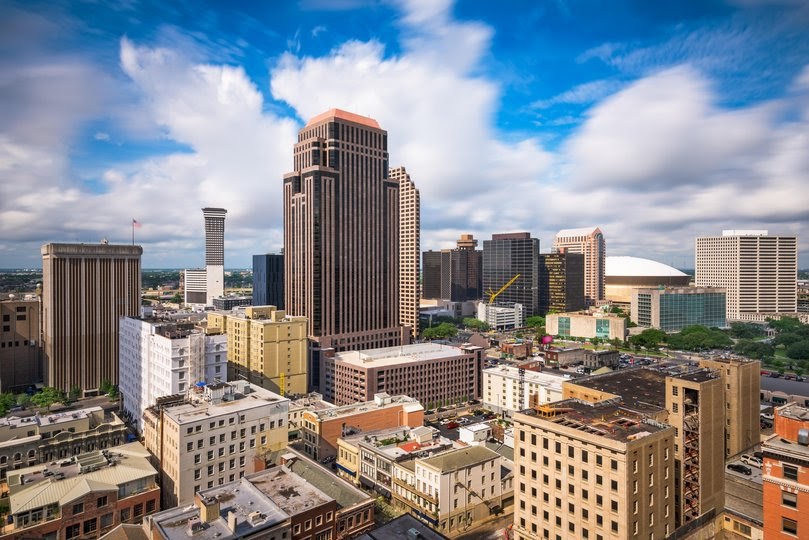
Photo Credit: Alamy Stock Photo
10. New Orleans-Metairie, LA
- Percentage of workers in physically demanding jobs: 10.7%
- Total workers in physically demanding jobs: 59,443
- Total workers across all jobs: 557,190
- Protective service workers: 18,640
- Construction workers: 23,630
- Installation, maintenance, & repair workers: 23,220
- Transportation & moving workers: 47,990
- Median annual wage (all workers): $35,620
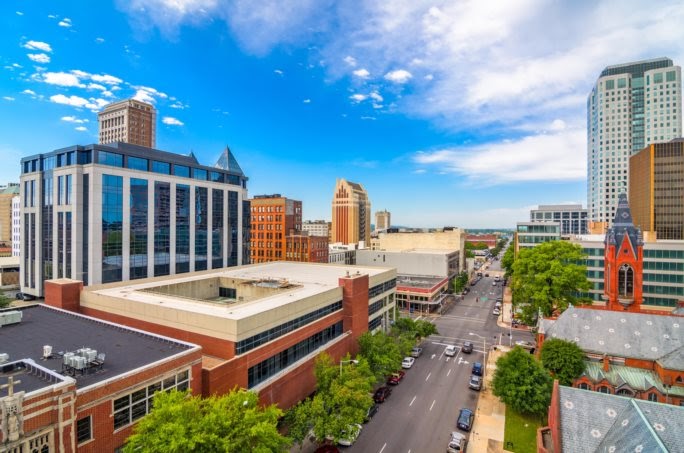
Photo Credit: Alamy Stock Photo
9. Birmingham-Hoover, AL
- Percentage of workers in physically demanding jobs: 10.8%
- Total workers in physically demanding jobs: 56,113
- Total workers across all jobs: 518,210
- Protective service workers: 13,710
- Construction workers: 23,770
- Installation, maintenance, & repair workers: 24,560
- Transportation & moving workers: 41,190
- Median annual wage (all workers): $38,020

Photo Credit: Alamy Stock Photo
8. Virginia Beach-Norfolk-Newport News, VA-NC
- Percentage of workers in physically demanding jobs: 10.8%
- Total workers in physically demanding jobs: 82,225
- Total workers across all jobs: 758,420
- Protective service workers: 21,040
- Construction workers: 39,470
- Installation, maintenance, & repair workers: 36,660
- Transportation & moving workers: 63,780
- Median annual wage (all workers): $38,960

Photo Credit: Alamy Stock Photo
7. Las Vegas-Henderson-Paradise, NV
- Percentage of workers in physically demanding jobs: 10.8%
- Total workers in physically demanding jobs: 109,739
- Total workers across all jobs: 1,019,890
- Protective service workers: 35,240
- Construction workers: 53,250
- Installation, maintenance, & repair workers: 34,390
- Transportation & moving workers: 88,500
- Median annual wage (all workers): $35,660

Photo Credit: Alamy Stock Photo
6. Houston-The Woodlands-Sugar Land, TX
- Percentage of workers in physically demanding jobs: 11.0%
- Total workers in physically demanding jobs: 335,896
- Total workers across all jobs: 3,052,170
- Protective service workers: 73,870
- Construction workers: 193,950
- Installation, maintenance, & repair workers: 133,010
- Transportation & moving workers: 258,690
- Median annual wage (all workers): $40,570

Photo Credit: Alamy Stock Photo
5. Indianapolis-Carmel-Anderson, IN
- Percentage of workers in physically demanding jobs: 11.1%
- Total workers in physically demanding jobs: 116,880
- Total workers across all jobs: 1,057,780
- Protective service workers: 23,730
- Construction workers: 42,030
- Installation, maintenance, & repair workers: 40,200
- Transportation & moving workers: 122,840
- Median annual wage (all workers): $39,030

Photo Credit: Alamy Stock Photo
4. Grand Rapids-Wyoming, MI
- Percentage of workers in physically demanding jobs: 11.6%
- Total workers in physically demanding jobs: 66,085
- Total workers across all jobs: 567,640
- Protective service workers: 7,530
- Construction workers: 19,100
- Installation, maintenance, & repair workers: 24,720
- Transportation & moving workers: 56,810
- Median annual wage (all workers): $37,410
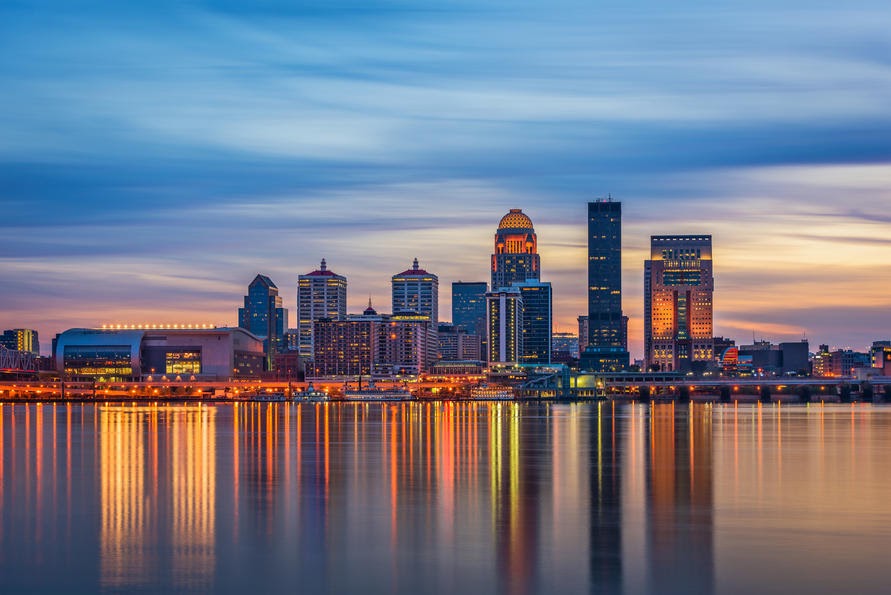
Photo Credit: Alamy Stock Photo
3. Louisville/Jefferson County, KY-IN
- Percentage of workers in physically demanding jobs: 11.6%
- Total workers in physically demanding jobs: 75,805
- Total workers across all jobs: 656,250
- Protective service workers: 12,410
- Construction workers: 23,750
- Installation, maintenance, & repair workers: 27,890
- Transportation & moving workers: 82,040
- Median annual wage (all workers): $37,460

Photo Credit: Alamy Stock Photo
2. Riverside-San Bernardino-Ontario, CA
- Percentage of workers in physically demanding jobs: 12.3%
- Total workers in physically demanding jobs: 188,989
- Total workers across all jobs: 1,538,400
- Protective service workers: 40,900
- Construction workers: 82,200
- Installation, maintenance, & repair workers: 59,480
- Transportation & moving workers: 207,620
- Median annual wage (all workers): $37,780

Photo Credit: Alamy Stock Photo
1. Memphis, TN-MS-AR
- Percentage of workers in physically demanding jobs: 12.6%
- Total workers in physically demanding jobs: 79,900
- Total workers across all jobs: 632,600
- Protective service workers: 21,110
- Construction workers: 18,330
- Installation, maintenance, & repair workers: 23,300
- Transportation & moving workers: 107,020
- Median annual wage (all workers): $35,540
Methodology & detailed findings
Workers involved in many physically demanding occupations remain essential due to the necessary labor and services they perform. For example, plumbers, electricians, and welders are still in demand despite the social distancing guidelines and increase in remote work for other types of occupations.
Despite many physically demanding jobs being “essential,” research suggests it may become increasingly difficult to hire for these roles. Experts project a shortage of workers in many of these jobs due to the bias toward four-year university degrees over career technical education (CTE)—training that is necessary for these careers. That said, these jobs may become more appealing to people entering the workforce as further research has shown that graduates of CTE programs have a higher employment rate and are more likely to be employed in a job related to their field of study when compared to graduates of purely academic programs.
The employment and wage data used in this study are from the U.S. Bureau of Labor Statistics 2019 Occupational Employment Statistics. Information on the physical demands of occupations is from the 2018 Occupational Requirements Survey. Specifically, researchers looked at the percentage of workers in each occupation where the strength requirement was either heavy or very heavy work.
To identify the percentage of workers in physically demanding jobs by location, strength requirement percentages were multiplied by each location’s occupation-specific employment numbers, summed, and then divided by the total employment for that location. Locations were ordered by the resulting statistic. In the event of a tie, the location with more total workers in physically demanding jobs was ranked higher.
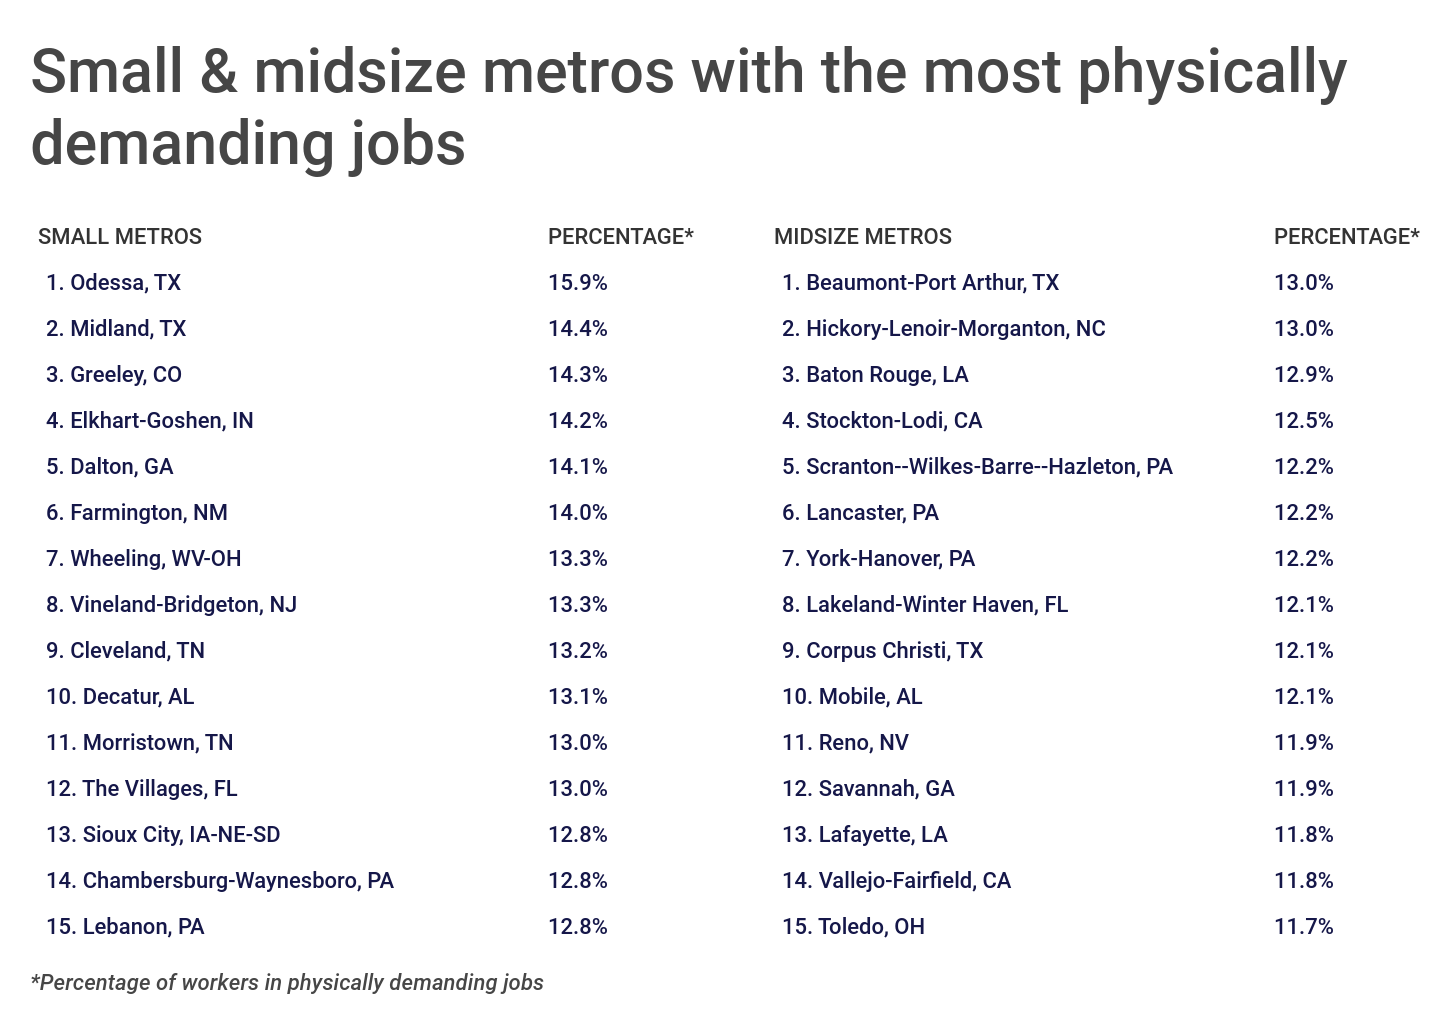
For additional insight, researchers grouped metropolitan areas into size cohorts based on population:
- Small (100,000-349,999)
- Midsize (350,000-999,999)
- Large (1,000,000 or more)