U.S. Cities Most Impacted By Sea Level Rise
Editor’s Note: This research report was published in 2020, and the data is no longer being updated. It has been kept live for historical reference.
Increasing global temperatures will bring changes to our environment, economy, and society, but one of the most pronounced effects will be the impact on sea level rise. A 2019 report from the UN’s Intergovernmental Panel on Climate Change (IPCC) estimated that global mean sea levels will most likely rise between 0.95 feet and 3.61 feet by 2100 due to thermal expansion of water, the melting of glacial ice, and disruption to major ocean currents. The IPCC estimates that worldwide, high seas could displace or affect 680 million people living in coastal areas.
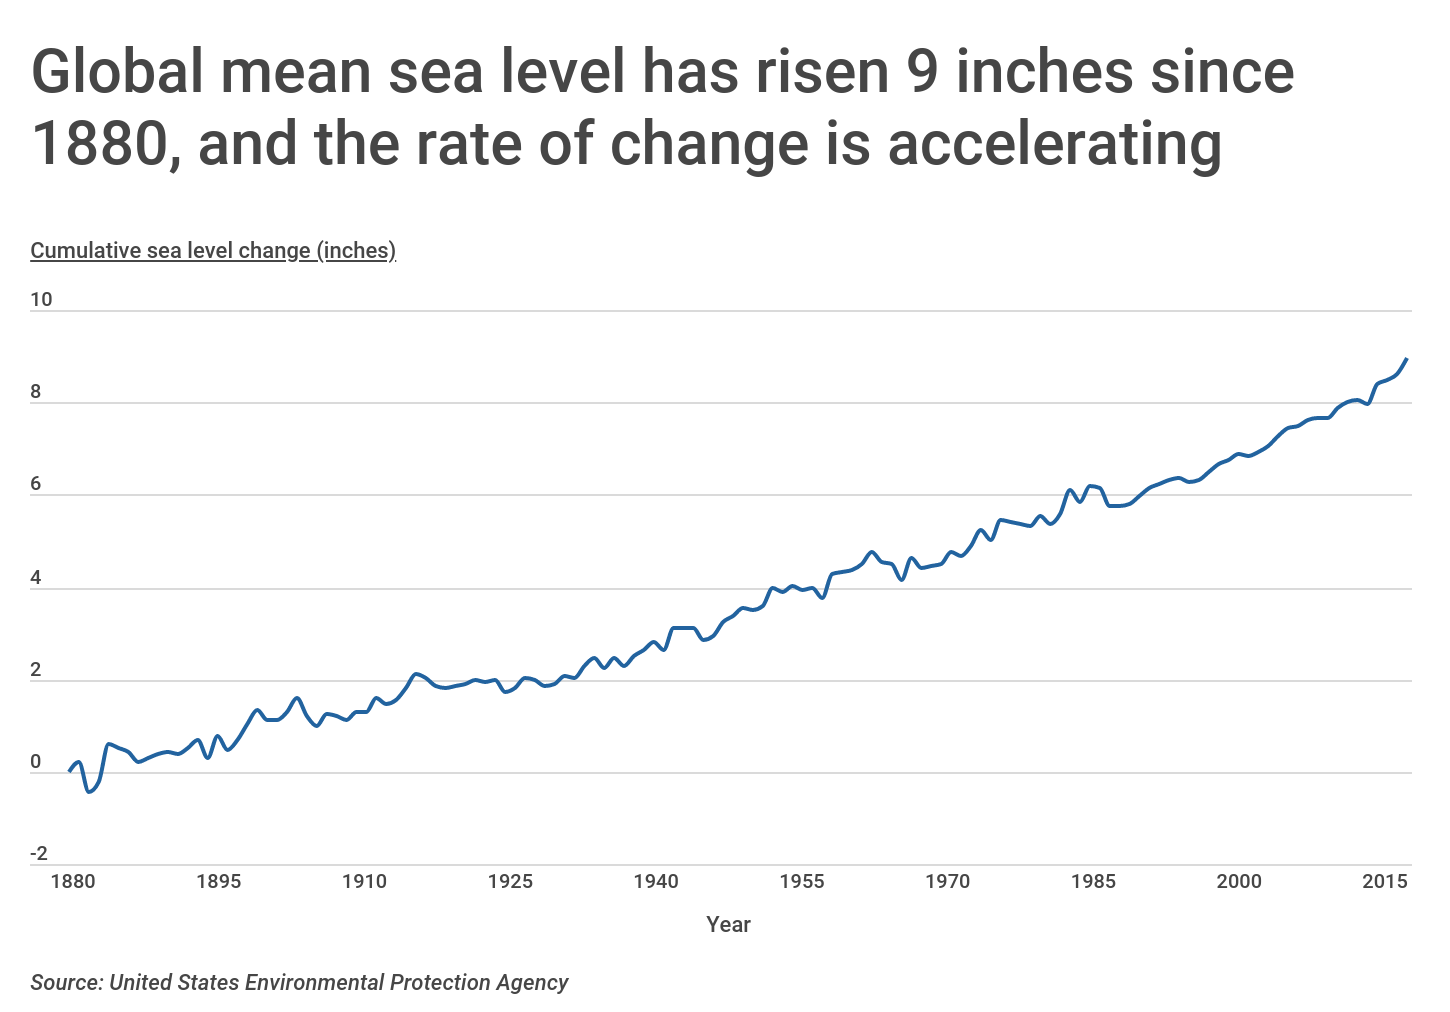
The IPCC’s report projects possible outcomes over the rest of this century, but sea level rise is already an observable occurrence. Data from the U.S. Environmental Protection Agency shows that global mean sea level has risen nearly 9 inches since 1880, and the rate of increase has accelerated over time. Beginning in 1880, it took nearly 20 years for sea level to rise by one inch. More recently, the mean sea level rose by one inch just from 2010 to 2015.
As the ocean rises, coastal areas will be more prone to severe storm surges and inland tidal flooding. This means that one of the biggest impacts of sea level rise in the coming decades will be the threat to infrastructure. Around 40% of the U.S. population currently lives in coastal areas that may be vulnerable to sea level rise. Because the rate of sea level rise is linked to climate change, the potential damage to these areas depends on how effectively the world can curb human contributions to warming. According to research from Climate Central and Zillow, a worst-case scenario of unchecked emissions could expose 3.4 million existing homes to high risk of flooding by 2100. Those homes are currently worth $1.75 trillion—roughly 9 percent of the U.S. economy.
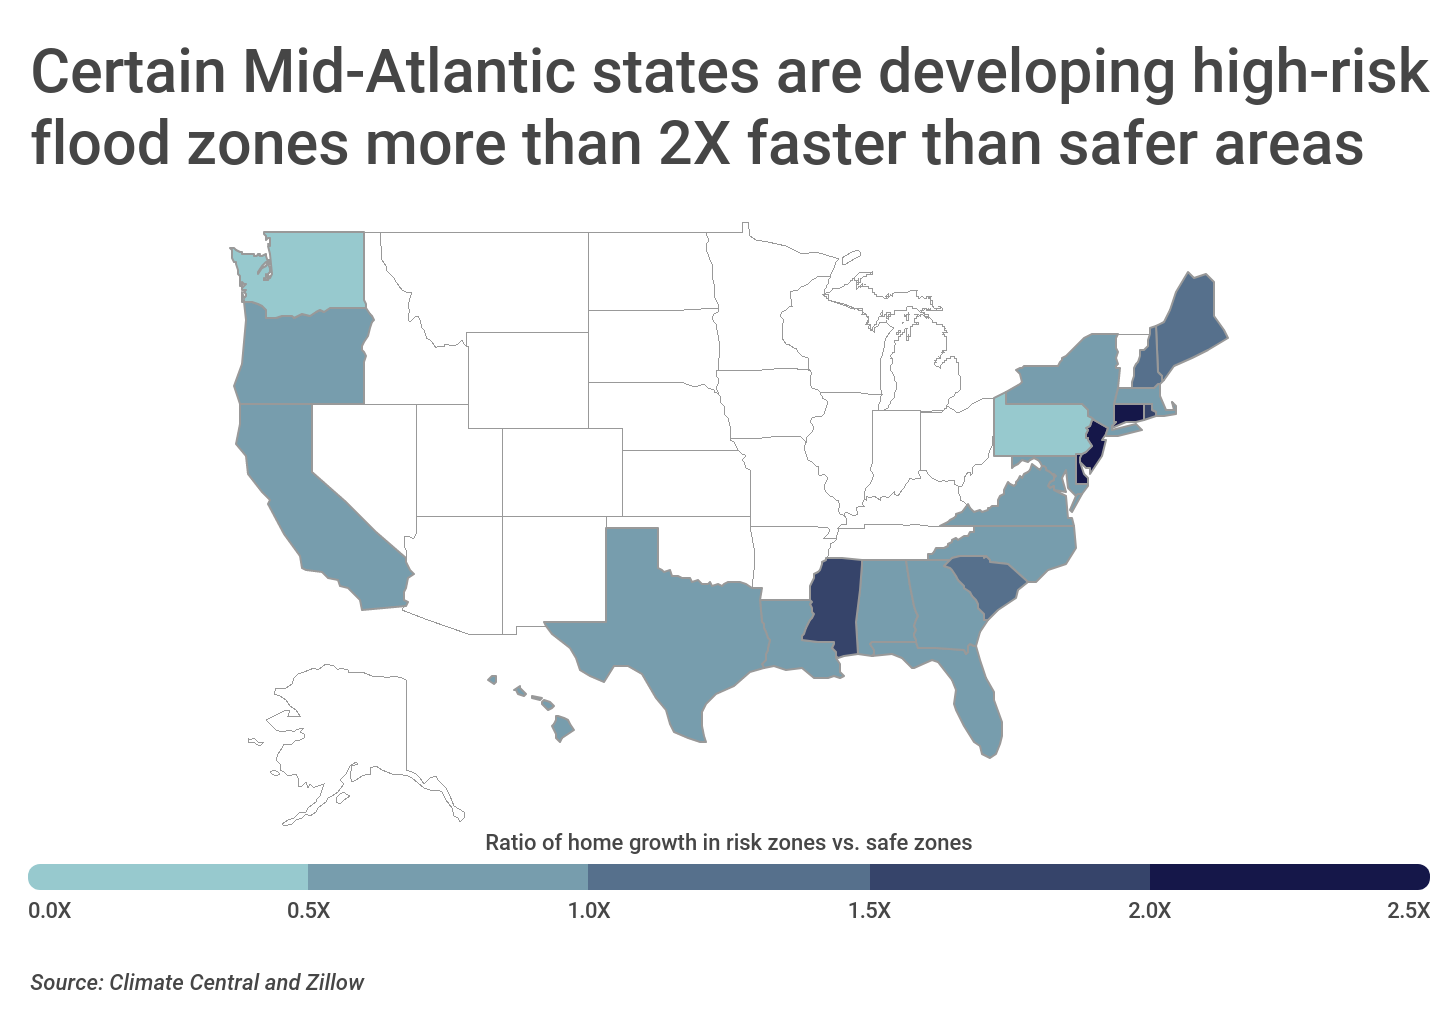
Despite these possibilities, construction and development continue in many areas with high-risk flood zones. In fact, the rate of development in high-risk flood zones exceeds the rate of development in lower-risk areas in eight states since 2010. At the top of the list are Mid-Atlantic states including Delaware, Connecticut, and New Jersey, which are seeing development in high-risk flood zones at a rate more than twice as fast as lower-risk areas. Those states are also among the most densely-populated in the U.S., which means that hundreds of thousands of existing homes could be at risk as well.
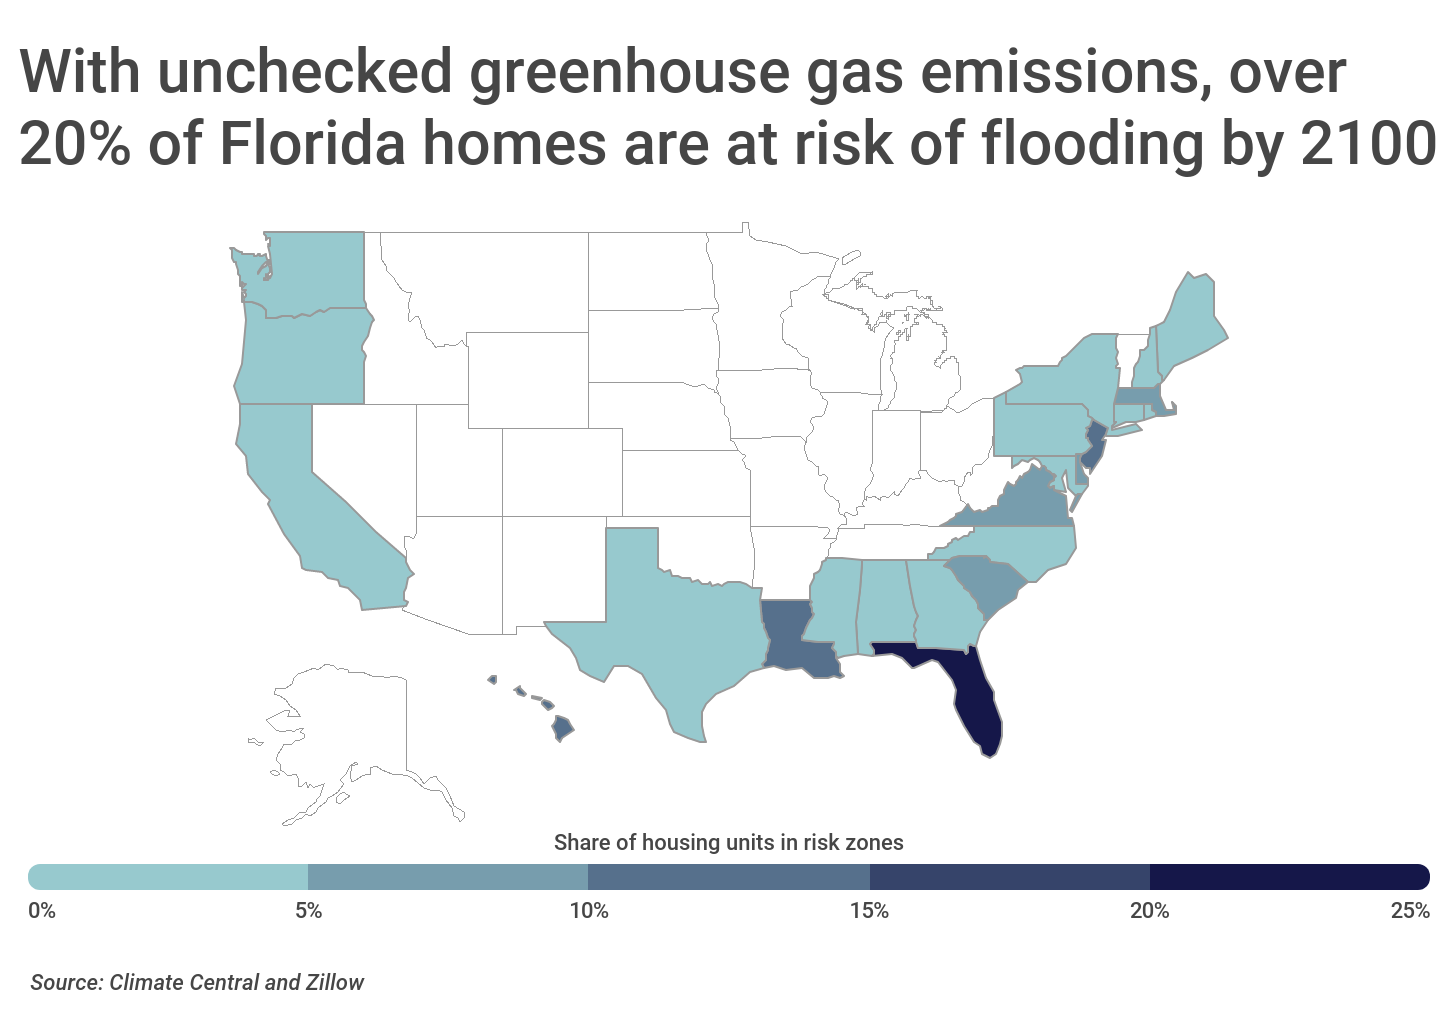
Another state especially susceptible to the risks of sea level rise is Florida. The state’s geographic features, including 1,200 miles of coastline and a large number of bays and estuaries, bring natural flood risks. With 21.1 percent of its housing units in risk zones, the potential consequences of flooding for property and infrastructure are enormous. Already, low-lying cities like Miami are experiencing frequent “sunny day flooding,” when high tides spill onto streets or bubble up from storm drains. Events like these will only become more common and more damaging as sea level rise continues.
Unsurprisingly, Florida is home to many of the U.S. cities likely to be most impacted by sea level rise, but other coastal communities throughout the country are vulnerable too. Using data from Ocean at the Door: New Homes and the Rising Sea, a research report conducted by Climate Central and Zillow, researchers at Construction Coverage set out to determine which communities are most at risk. The researchers considered the total share of housing units projected to be in risk zones by 2100, assuming a worst-case scenario of unchecked pollution, along with information about housing values, the share (and value) of new housing in risk zones, and the ratio of housing growth in risk zones versus safe zones.
Here are the locations most threatened by sea level rise.
Major cities projected to be most impacted by sea level rise
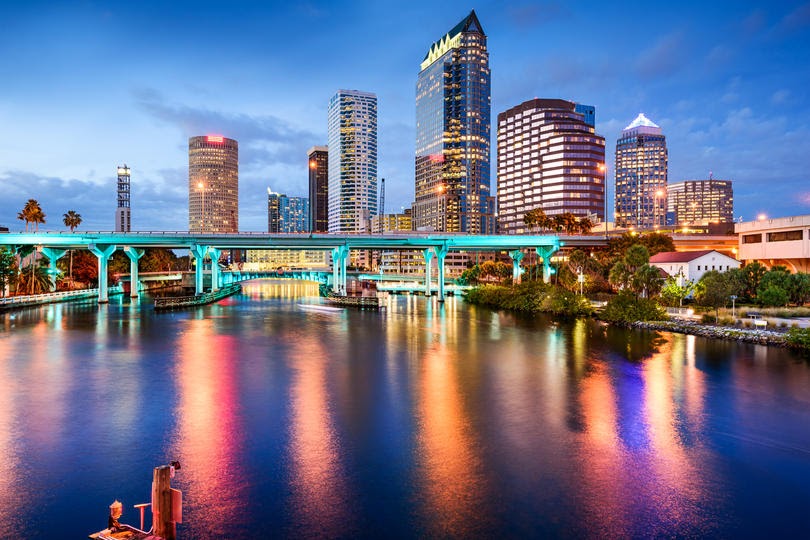
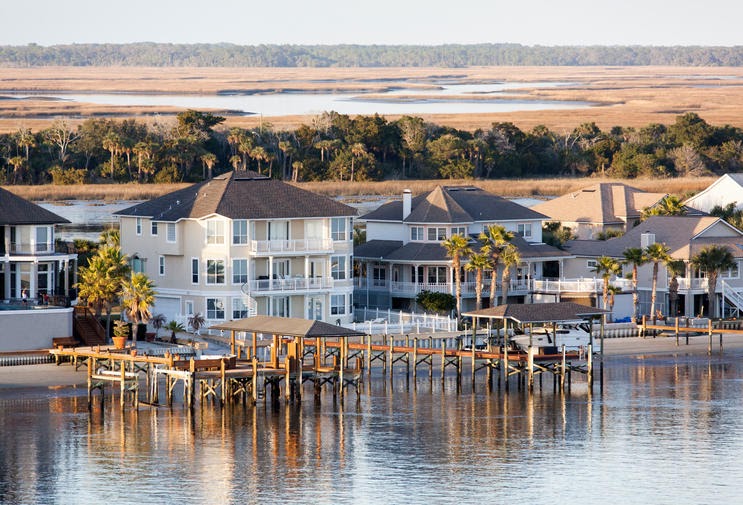
Photo Credit: Alamy Stock Photo
25. Tampa, FL
- Share of housing units in risk zones: 16.2% (18,260 units)
- Share of housing value in risk zones: 29.9% ($11,084,477,888)
- Share of new housing units in risk zones: 19.1%
- Share of new housing value in risk zones: 34.2%
- Ratio of home growth in risk zones vs. safe zones: 1.46

Photo Credit: Alamy Stock Photo
24. Huntington Beach, CA
- Share of housing units in risk zones: 21.3% (12,136 units)
- Share of housing value in risk zones: 23.2% ($12,404,124,125)
- Share of new housing units in risk zones: 8.0%
- Share of new housing value in risk zones: 12.2%
- Ratio of home growth in risk zones vs. safe zones: 0.31

Photo Credit: Alamy Stock Photo
23. Stockton, CA
- Share of housing units in risk zones: 23.3% (17,539 units)
- Share of housing value in risk zones: 24.7% ($5,740,624,930)
- Share of new housing units in risk zones: 3.0%
- Share of new housing value in risk zones: 3.4%
- Ratio of home growth in risk zones vs. safe zones: 0.10
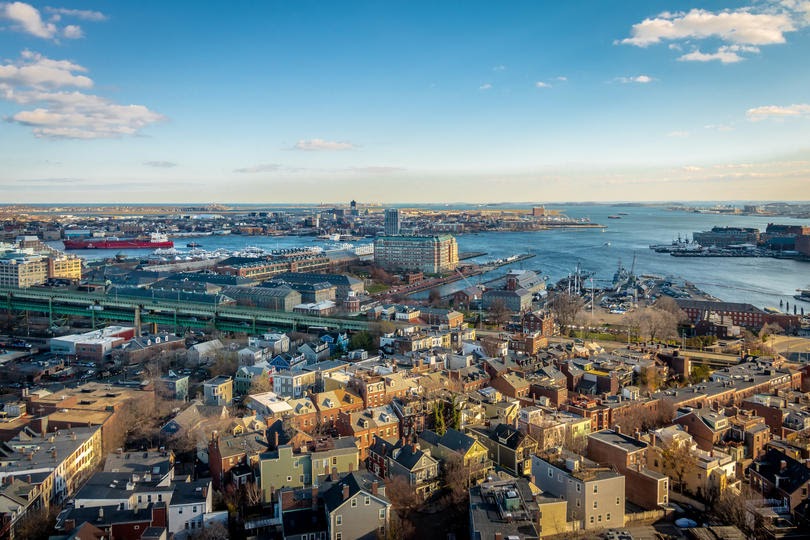
Photo Credit: Alamy Stock Photo
22. Boston, MA
- Share of housing units in risk zones: 25.0% (29,534 units)
- Share of housing value in risk zones: 37.4% ($39,167,817,339)
- Share of new housing units in risk zones: 18.3%
- Share of new housing value in risk zones: 74.0%
- Ratio of home growth in risk zones vs. safe zones: 1.72

Photo Credit: Alamy Stock Photo
21. Clearwater, FL
- Share of housing units in risk zones: 25.6% (10,233 units)
- Share of housing value in risk zones: 47.4% ($5,976,288,068)
- Share of new housing units in risk zones: 14.3%
- Share of new housing value in risk zones: 53.0%
- Ratio of home growth in risk zones vs. safe zones: 1.89
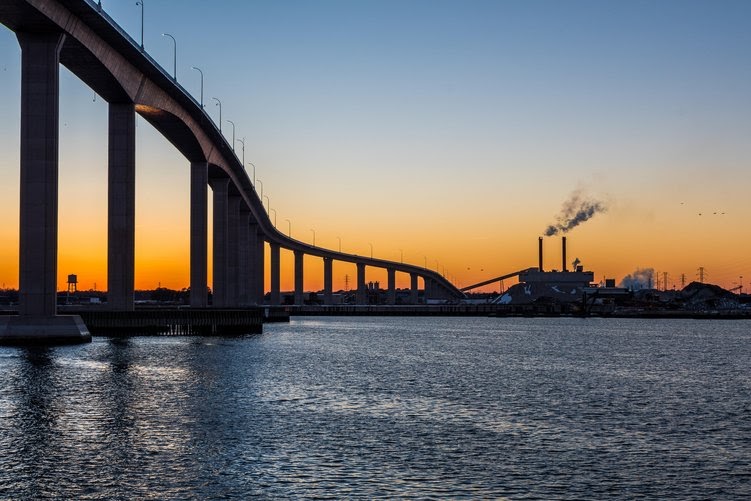
Photo Credit: Alamy Stock Photo
20. Chesapeake, VA
- Share of housing units in risk zones: 26.7% (19,936 units)
- Share of housing value in risk zones: 26.9% ($5,664,810,715)
- Share of new housing units in risk zones: 24.2%
- Share of new housing value in risk zones: 24.9%
- Ratio of home growth in risk zones vs. safe zones: 0.88
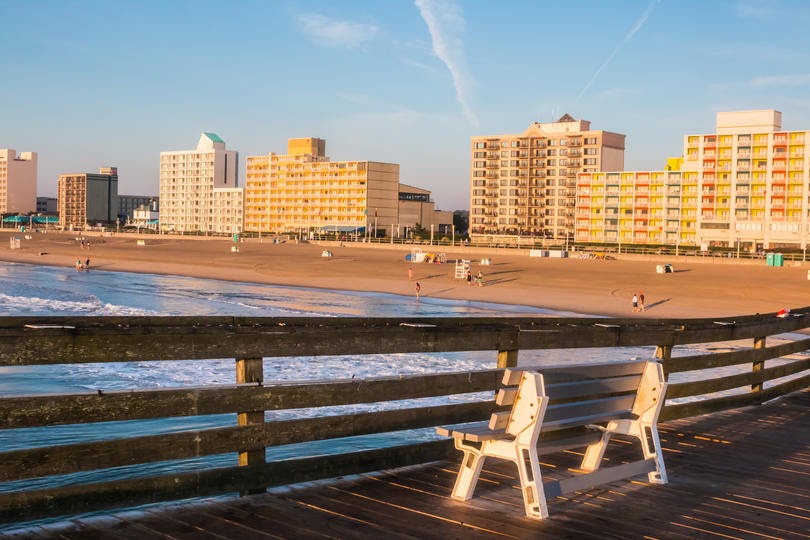
Photo Credit: Alamy Stock Photo
19. Virginia Beach, VA
- Share of housing units in risk zones: 29.6% (42,293 units)
- Share of housing value in risk zones: 34.8% ($16,482,749,465)
- Share of new housing units in risk zones: 36.9%
- Share of new housing value in risk zones: 44.3%
- Ratio of home growth in risk zones vs. safe zones: 1.51

Photo Credit: Alamy Stock Photo
18. Jersey City, NJ
- Share of housing units in risk zones: 35.3% (16,921 units)
- Share of housing value in risk zones: 52.4% ($16,568,025,211)
- Share of new housing units in risk zones: 16.8%
- Share of new housing value in risk zones: 67.9%
- Ratio of home growth in risk zones vs. safe zones: 0.75
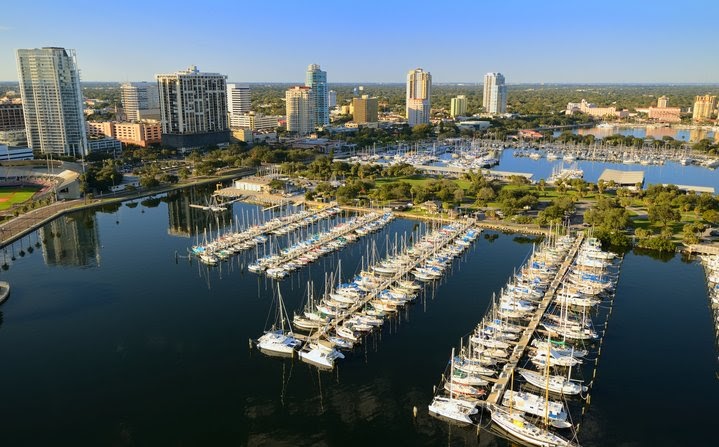
Photo Credit: Alamy Stock Photo
17. St. Petersburg, FL
- Share of housing units in risk zones: 37.0% (33,246 units)
- Share of housing value in risk zones: 49.2% ($12,910,003,794)
- Share of new housing units in risk zones: 0.0%
- Share of new housing value in risk zones: 0.0%
- Ratio of home growth in risk zones vs. safe zones: N/A

Photo Credit: Alamy Stock Photo
16. Honolulu, HI
- Share of housing units in risk zones: 38.0% (40,405 units)
- Share of housing value in risk zones: 16.1% ($27,162,518,458)
- Share of new housing units in risk zones: 5.8%
- Share of new housing value in risk zones: 8.7%
- Ratio of home growth in risk zones vs. safe zones: 1.48

Photo Credit: Alamy Stock Photo
15. Cambridge, MA
- Share of housing units in risk zones: 40.1% (8,340 units)
- Share of housing value in risk zones: 40.8% ($11,010,866,783)
- Share of new housing units in risk zones: 56.9%
- Share of new housing value in risk zones: 84.7%
- Ratio of home growth in risk zones vs. safe zones: 2.22

Photo Credit: Alamy Stock Photo
14. Cape Coral, FL
- Share of housing units in risk zones: 42.5% (32,898 units)
- Share of housing value in risk zones: 52.8% ($11,468,787,539)
- Share of new housing units in risk zones: 72.5%
- Share of new housing value in risk zones: 82.7%
- Ratio of home growth in risk zones vs. safe zones: 1.33

Photo Credit: Alamy Stock Photo
13. San Mateo, CA
- Share of housing units in risk zones: 43.3% (11,359 units)
- Share of housing value in risk zones: 35.9% ($15,267,459,492)
- Share of new housing units in risk zones: 81.1%
- Share of new housing value in risk zones: 73.6%
- Ratio of home growth in risk zones vs. safe zones: 5.02
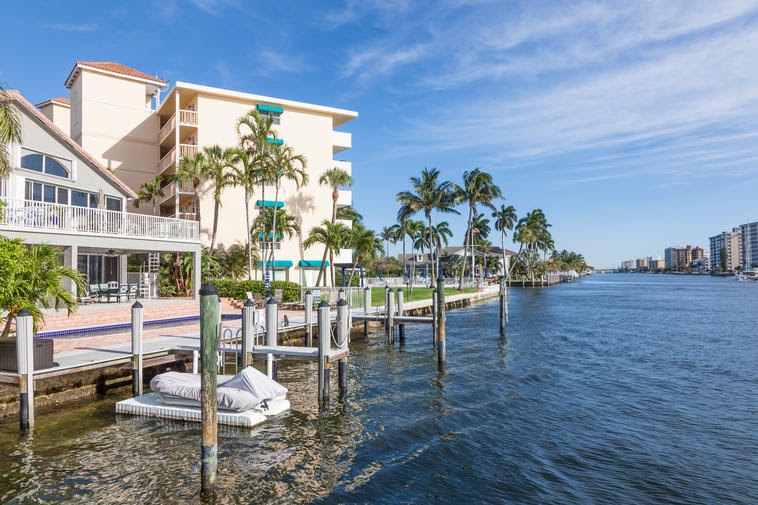
Photo Credit: Alamy Stock Photo
12. Pompano Beach, FL
- Share of housing units in risk zones: 46.1% (19,787 units)
- Share of housing value in risk zones: 57.3% ($7,090,910,586)
- Share of new housing units in risk zones: 97.7%
- Share of new housing value in risk zones: 92.0%
- Ratio of home growth in risk zones vs. safe zones: 87.3
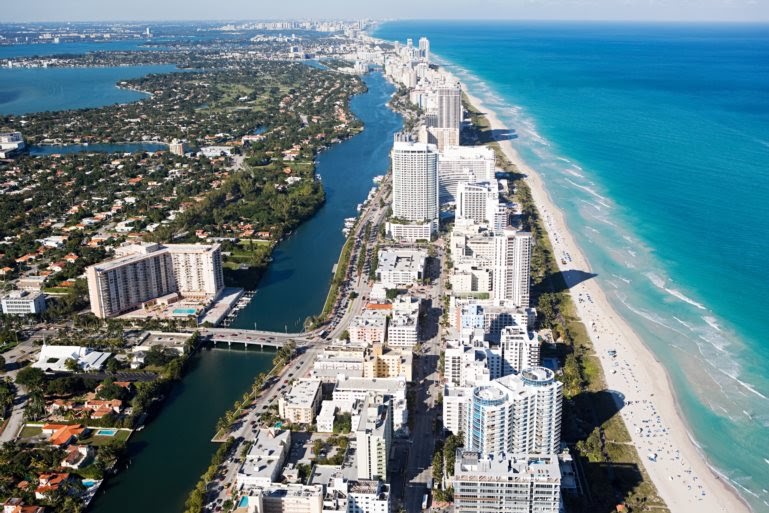
Photo Credit: Alamy Stock Photo
11. Miami, FL
- Share of housing units in risk zones: 46.9% (50,816 units)
- Share of housing value in risk zones: 48.2% ($25,507,729,986)
- Share of new housing units in risk zones: 17.2%
- Share of new housing value in risk zones: 53.2%
- Ratio of home growth in risk zones vs. safe zones: 0.96

Photo Credit: Alamy Stock Photo
10. Charleston, SC
- Share of housing units in risk zones: 50.6% (22,845 units)
- Share of housing value in risk zones: 62.3% ($13,409,123,763)
- Share of new housing units in risk zones: 50.2%
- Share of new housing value in risk zones: 67.9%
- Ratio of home growth in risk zones vs. safe zones: 1.07
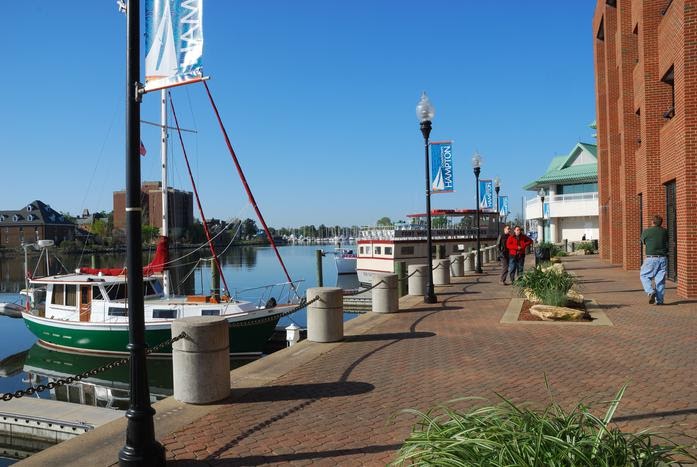
Photo Credit: Alamy Stock Photo
9. Hampton, VA
- Share of housing units in risk zones: 50.9% (22,318 units)
- Share of housing value in risk zones: 53.1% ($4,174,490,168)
- Share of new housing units in risk zones: 44.9%
- Share of new housing value in risk zones: 45.2%
- Ratio of home growth in risk zones vs. safe zones: 0.80
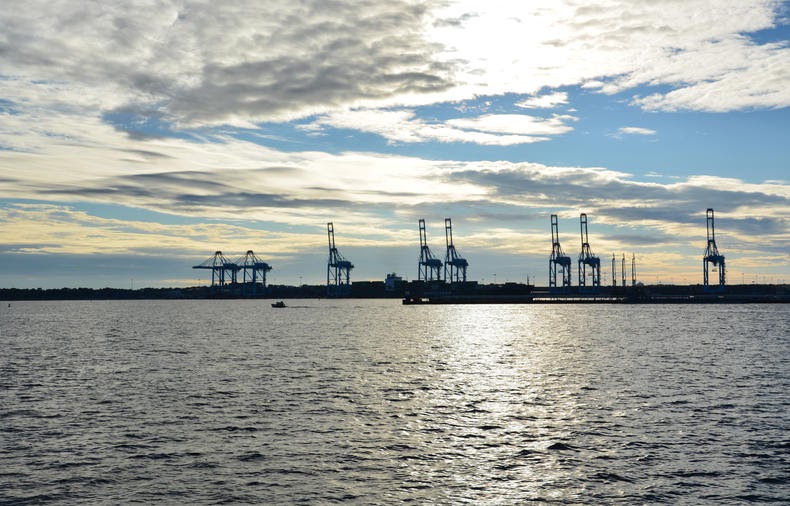
Photo Credit: Alamy Stock Photo
8. Norfolk, VA
- Share of housing units in risk zones: 51.6% (29,856 units)
- Share of housing value in risk zones: 60.0% ($7,865,157,705)
- Share of new housing units in risk zones: 51.7%
- Share of new housing value in risk zones: 56.0%
- Ratio of home growth in risk zones vs. safe zones: 1.10
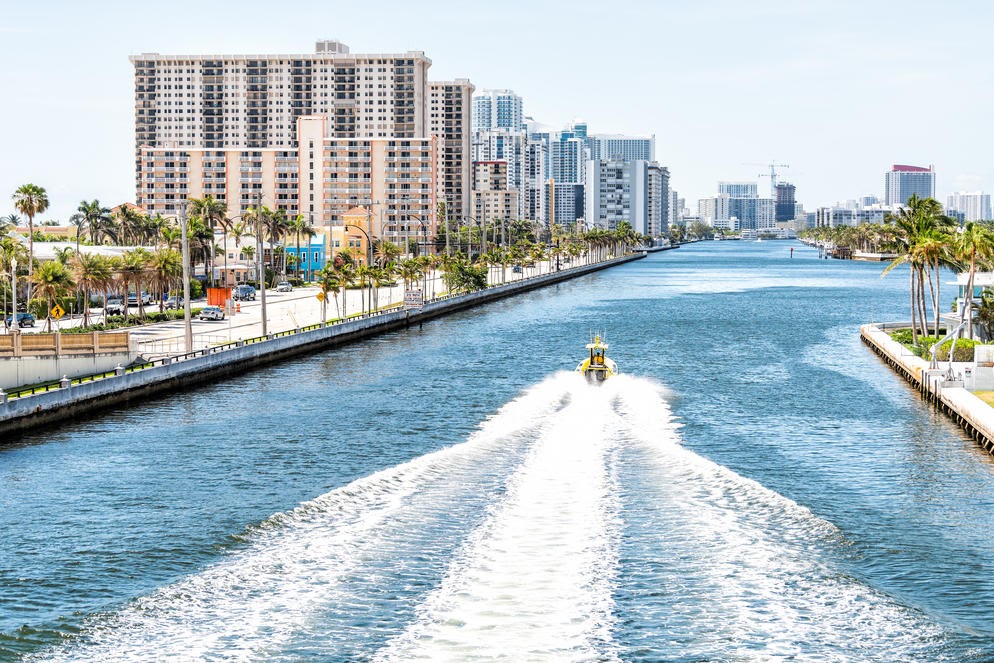
Photo Credit: Alamy Stock Photo
7. Hollywood, FL
- Share of housing units in risk zones: 59.8% (30,533 units)
- Share of housing value in risk zones: 70.0% ($12,090,411,970)
- Share of new housing units in risk zones: 40.8%
- Share of new housing value in risk zones: 71.8%
- Ratio of home growth in risk zones vs. safe zones: 0.58
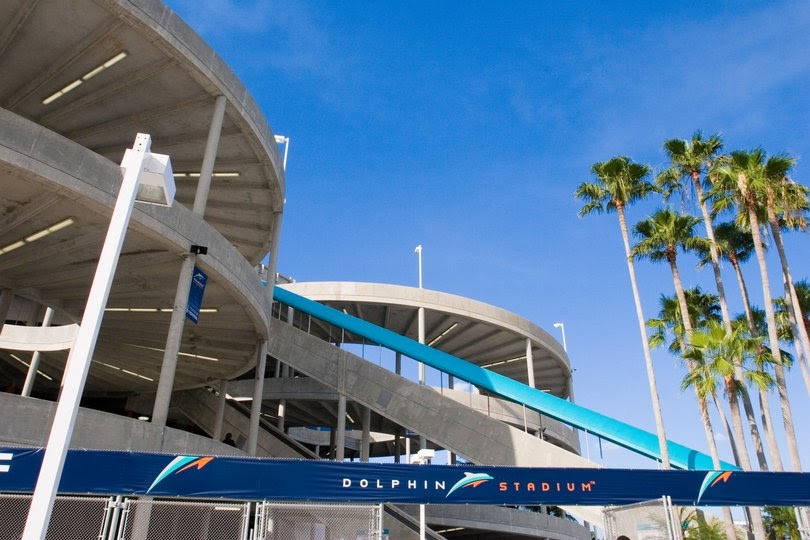
Photo Credit: Alamy Stock Photo
6. Miami Gardens, FL
- Share of housing units in risk zones: 71.4% (20,515 units)
- Share of housing value in risk zones: 70.4% ($4,725,426,423)
- Share of new housing units in risk zones: 0.0%
- Share of new housing value in risk zones: 0.0%
- Ratio of home growth in risk zones vs. safe zones: N/A
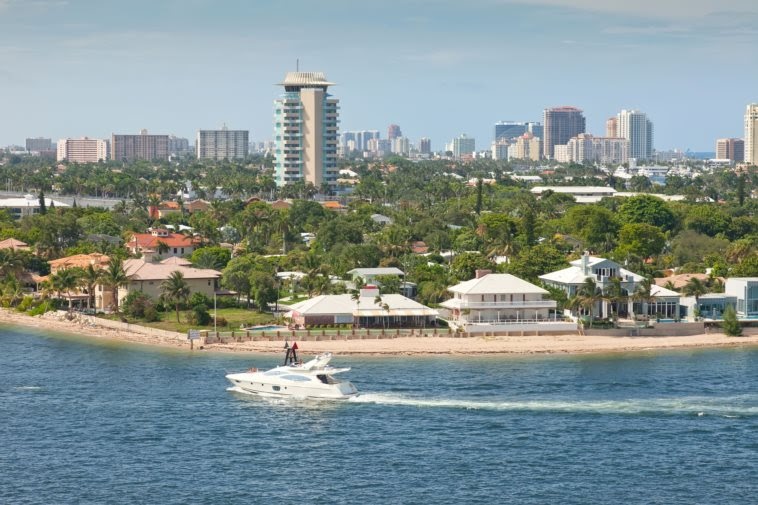
Photo Credit: Alamy Stock Photo
5. Fort Lauderdale, FL
- Share of housing units in risk zones: 73.4% (48,205 units)
- Share of housing value in risk zones: 75.5% ($26,670,397,210)
- Share of new housing units in risk zones: 90.1%
- Share of new housing value in risk zones: 90.0%
- Ratio of home growth in risk zones vs. safe zones: 2.99

Hialeah is a city in the Miami Metropolitan area; Photo Credit: Alamy Stock Photo
4. Hialeah, FL
- Share of housing units in risk zones: 90.7% (46,721 units)
- Share of housing value in risk zones: 88.4% ($11,609,490,525)
- Share of new housing units in risk zones: 99.7%
- Share of new housing value in risk zones: 99.6%
- Ratio of home growth in risk zones vs. safe zones: 50.5

Photo Credit: Alamy Stock Photo
3. Davie, FL
- Share of housing units in risk zones: 91.8% (25,832 units)
- Share of housing value in risk zones: 89.3% ($9,973,937,459)
- Share of new housing units in risk zones: 100.0%
- Share of new housing value in risk zones: 100.0%
- Ratio of home growth in risk zones vs. safe zones: ˆž
Photo Credit: Alamy Stock Photo
2. Pembroke Pines, FL
- Share of housing units in risk zones: 94.5% (52,551 units)
- Share of housing value in risk zones: 94.8% ($16,103,259,854)
- Share of new housing units in risk zones: 50.0%
- Share of new housing value in risk zones: 72.3%
- Ratio of home growth in risk zones vs. safe zones: 0.06
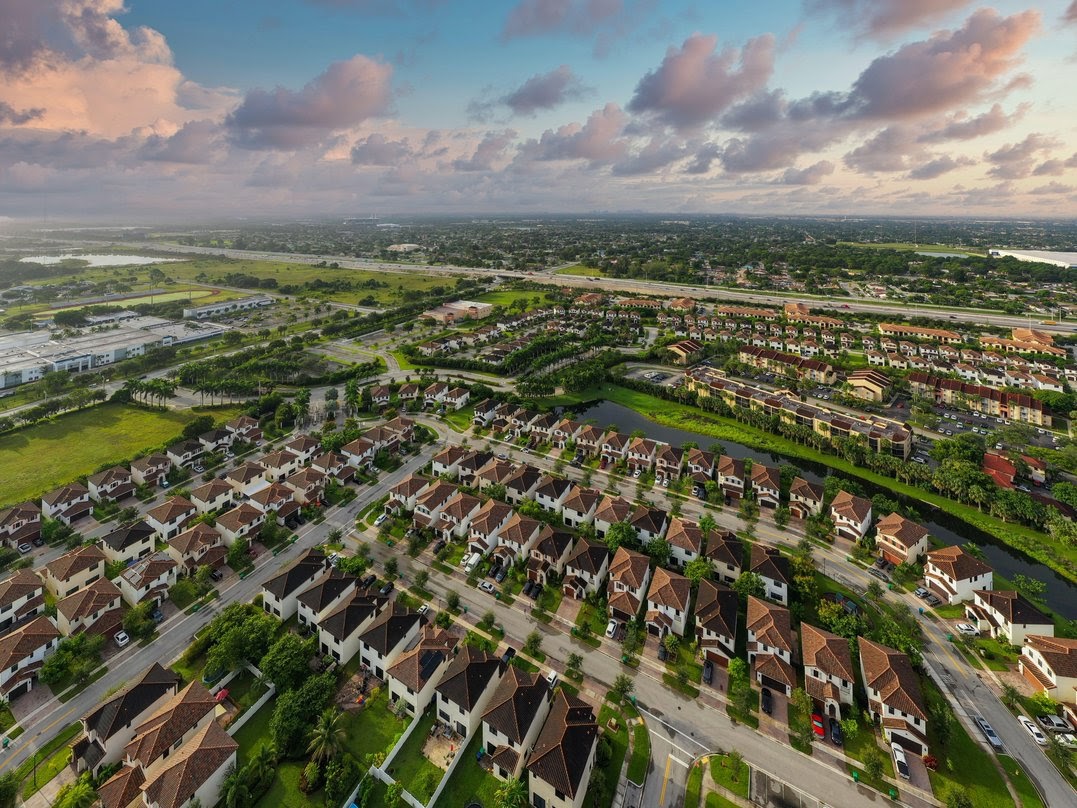
Photo Credit: Alamy Stock Photo
1. Miramar, FL
- Share of housing units in risk zones: 95.2% (35,074 units)
- Share of housing value in risk zones: 96.3% ($12,093,132,682)
- Share of new housing units in risk zones: 100.0%
- Share of new housing value in risk zones: 100.0%
- Ratio of home growth in risk zones vs. safe zones: ˆž
Methodology & Detailed Findings
The data used in this study is from Ocean at the Door: New Homes and the Rising Sea, a research report conducted by Climate Central and Zillow assessing the impact of sea level rise on coastal states and cities in the United States. Risk zones are defined as areas exposed to a 10 percent or greater annual flood threat based on three different emissions scenarios (deep emissions cuts, moderate emissions cuts, or unchecked pollution) and two different time periods (by 2050 or by 2100). Only residential buildings, such as single-family homes, condominiums, and duplexes, were included in the analysis. Buildings zoned for commercial or commercial residential use, such as apartment complexes, were not included. New homes were defined as those built after 2009.
To determine the cities most impacted by sea level rise, researchers at Construction Coverage ordered locations based on the share of total housing units projected to be in risk zones by the year 2100, assuming unchecked pollution (i.e. the worst case scenario). Additionally, researchers included information on the share of housing value in risk zones, the share of new housing (and value) in risk zones, and the ratio of housing growth in risk zones compared to safe zones. Housing growth rates for each zone were calculated by dividing the number of new homes (2010 and later) by the number of existing homes (2009 and earlier).
Only coastal cities with at least 100,000 residents were included in the analysis. Due to insufficient data, the state of Alaska and Alaskan cities were not included.