
The Best-Paying U.S. Cities for Architects in 2022
The U.S. economy today has no lack of opportunities for architects. An ongoing shortage of housing stock contributed to the dramatic spike in housing prices over the last two years, illustrating a need for professionals who can help make design and construction more affordable and efficient. The threat of climate change has increased interest in designers with expertise in energy efficiency, sustainability, and resilience. And the landmark Bipartisan Infrastructure Law passed in 2021 will pour billions of dollars into projects requiring the services of architects, engineers, and other design professionals.
While demand for architects’ services appears likely to remain high and even grow in coming years, the future of overall employment in the field is more uncertain. The Bureau of Labor Statistics projects 3% growth in employment for architects by 2030, a rate slower than the average for all occupations. While retirements and transitions to different industries will continue to create job openings, improved software and technologies have made architects more productive. This means that fewer architects will be needed to handle similar volumes of work.
RELATED
Errors and omissions insurance protects professionals like architects from lawsuits resulting from mistakes they make in rendering services for clients.
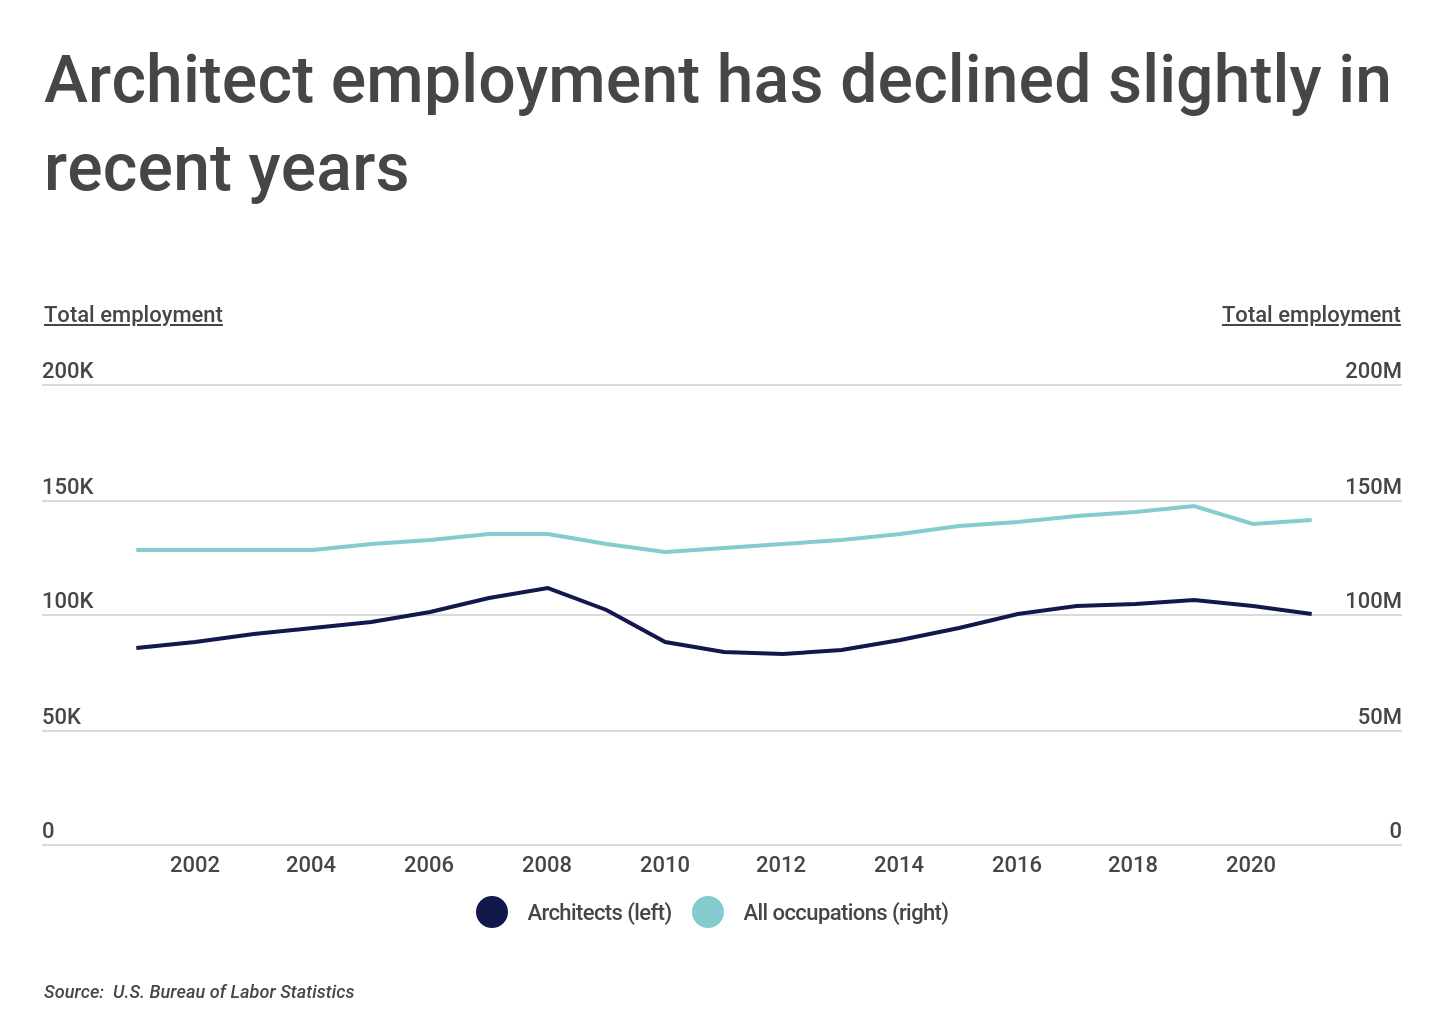
Recent employment data has already shown signs of potential decline in the field. Like many other construction-related occupations, total employment for architects fell sharply when the housing bubble burst and the Great Recession began. From 2008 to 2012, the number of architects in the U.S. declined by more than a quarter, a rate of employment loss far greater than the economy as a whole experienced. But even after recovering to near pre-recession levels in 2019, total employment for architects has remained down over the past two years.
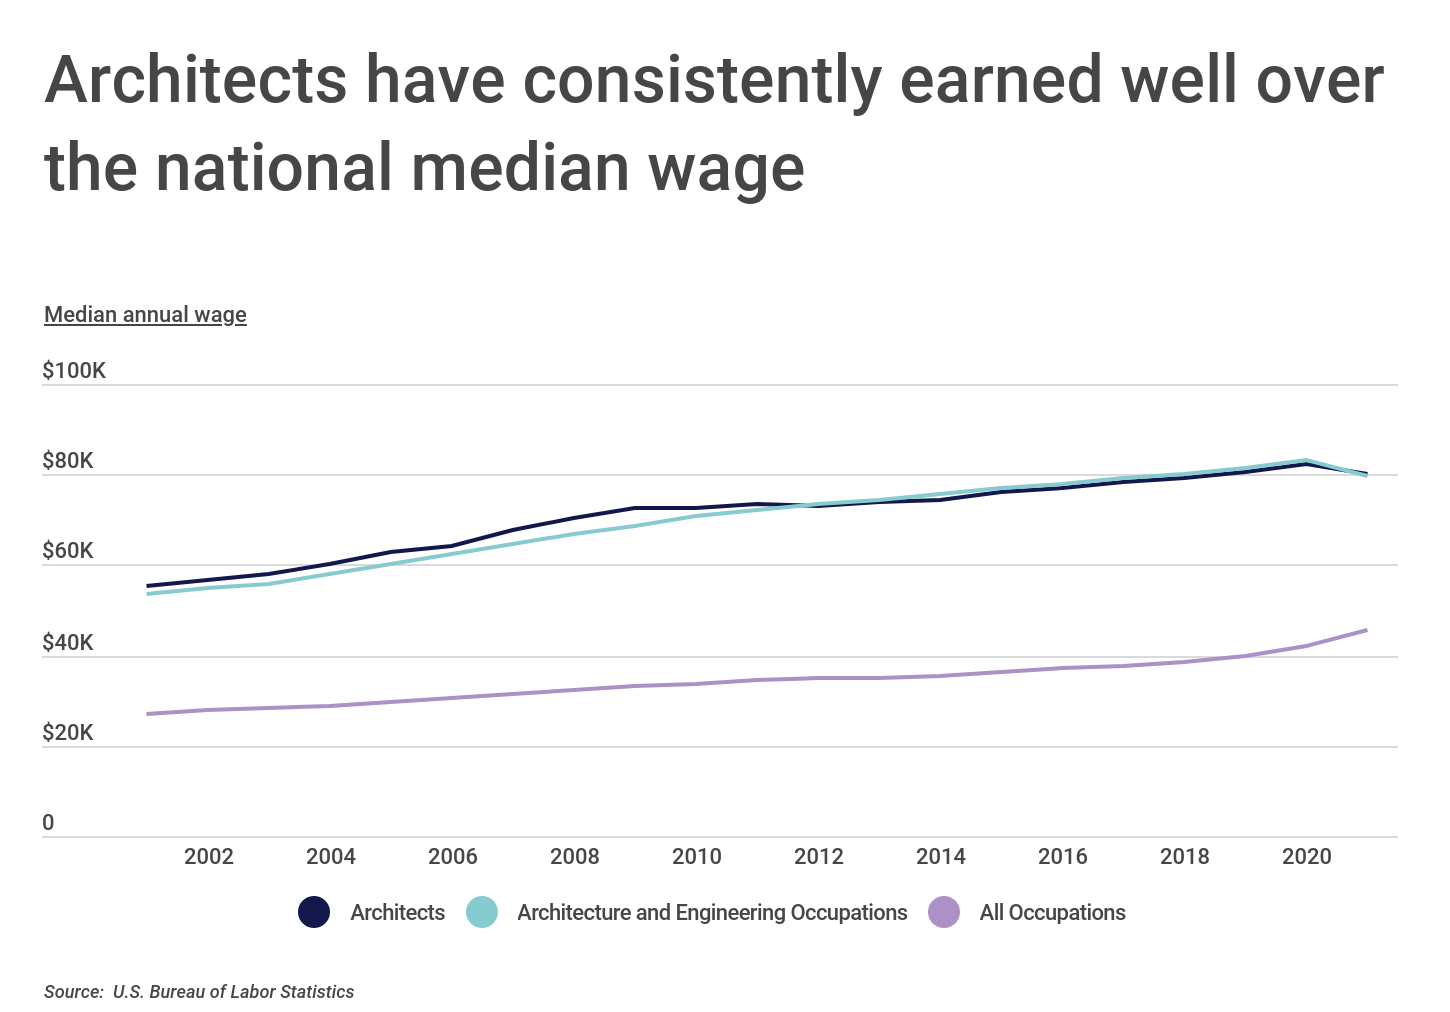
Strong educational and licensure requirements for practitioners also constrains the supply of new architects. To practice as an architect, one must usually obtain a bachelor’s or master’s degree in the field, complete a multi-year internship, pass a licensing exam, and meet continuing education requirements. But because of the specialized knowledge and training required to practice in the field, architects tend to be well-compensated compared to other occupations. From 2001 to 2020, the median wage for an architect was more than double the median wage for all occupations, though this gap narrowed slightly in 2021. The overall median wage for an architect today sits at $80,180.
FOR CONSTRUCTION PROFESSIONALS
New technologies like construction management software and takeoff software allow architects and contractors to more effectively collaborate on projects.
However, architects’ earning potential can vary significantly between locations in the U.S. When adjusted for cost of living, the typical salary for an architect is highest in Arizona, where the median adjusted wage is $97,153 per year. The list of best-paying states also includes Alaska, Massachusetts, California, and New York.
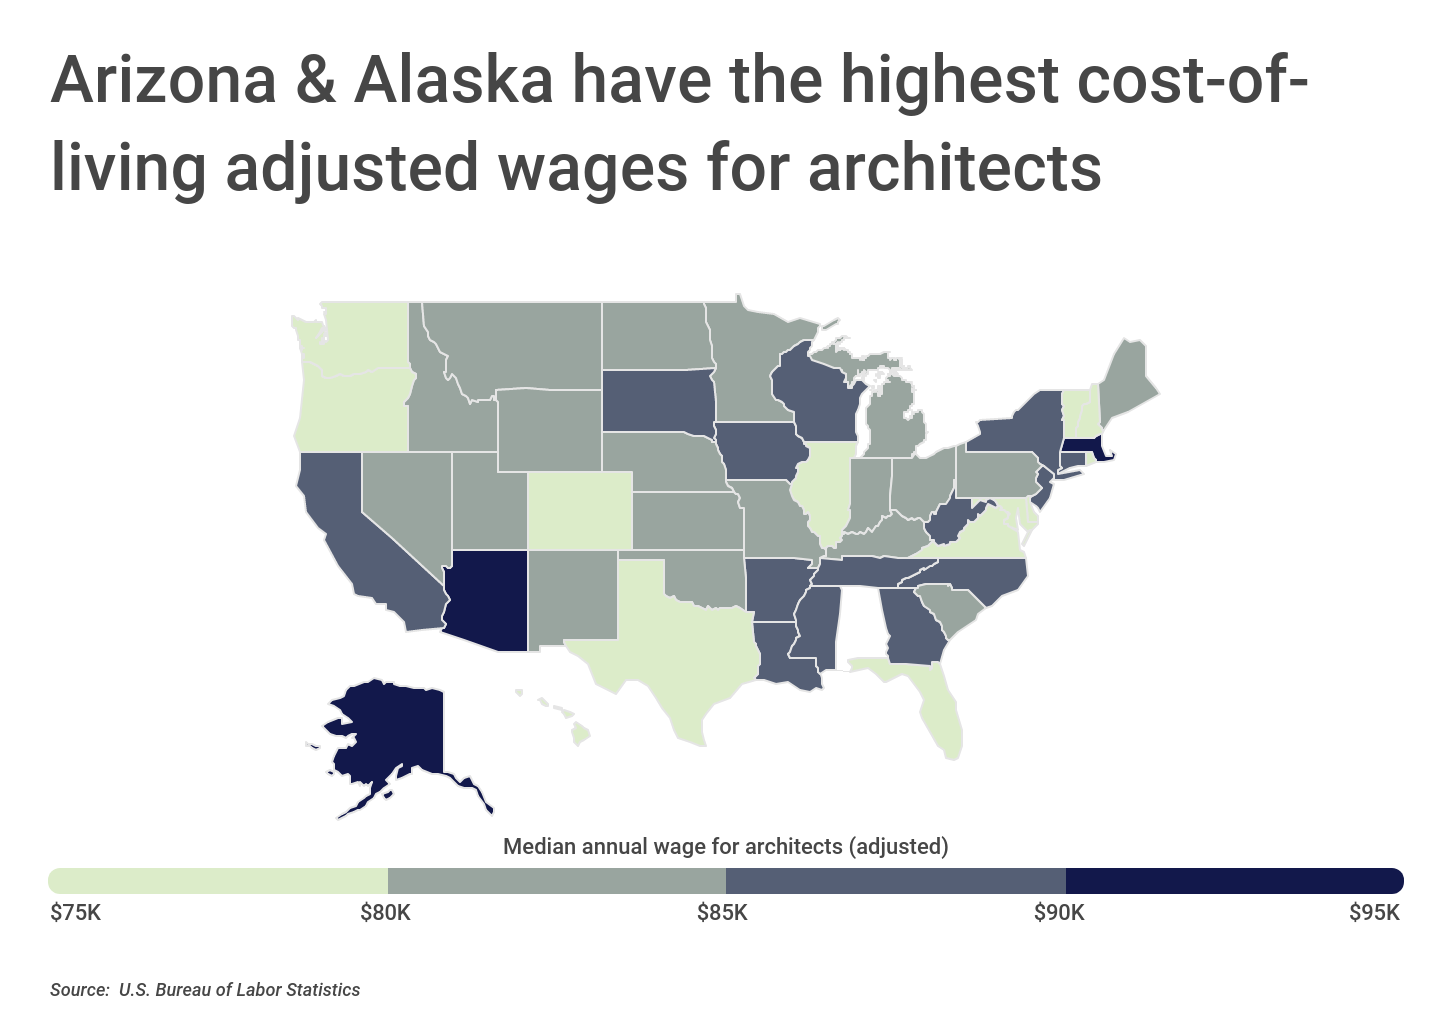
These top states also host many of the best-paying cities for architects. Locations like Phoenix, Boston, the Bay Area, and New York City are fast-growing areas that provide plentiful opportunities for architects. Median wages in these locations far exceed the national median for architects, in some cases approaching six figures annually.
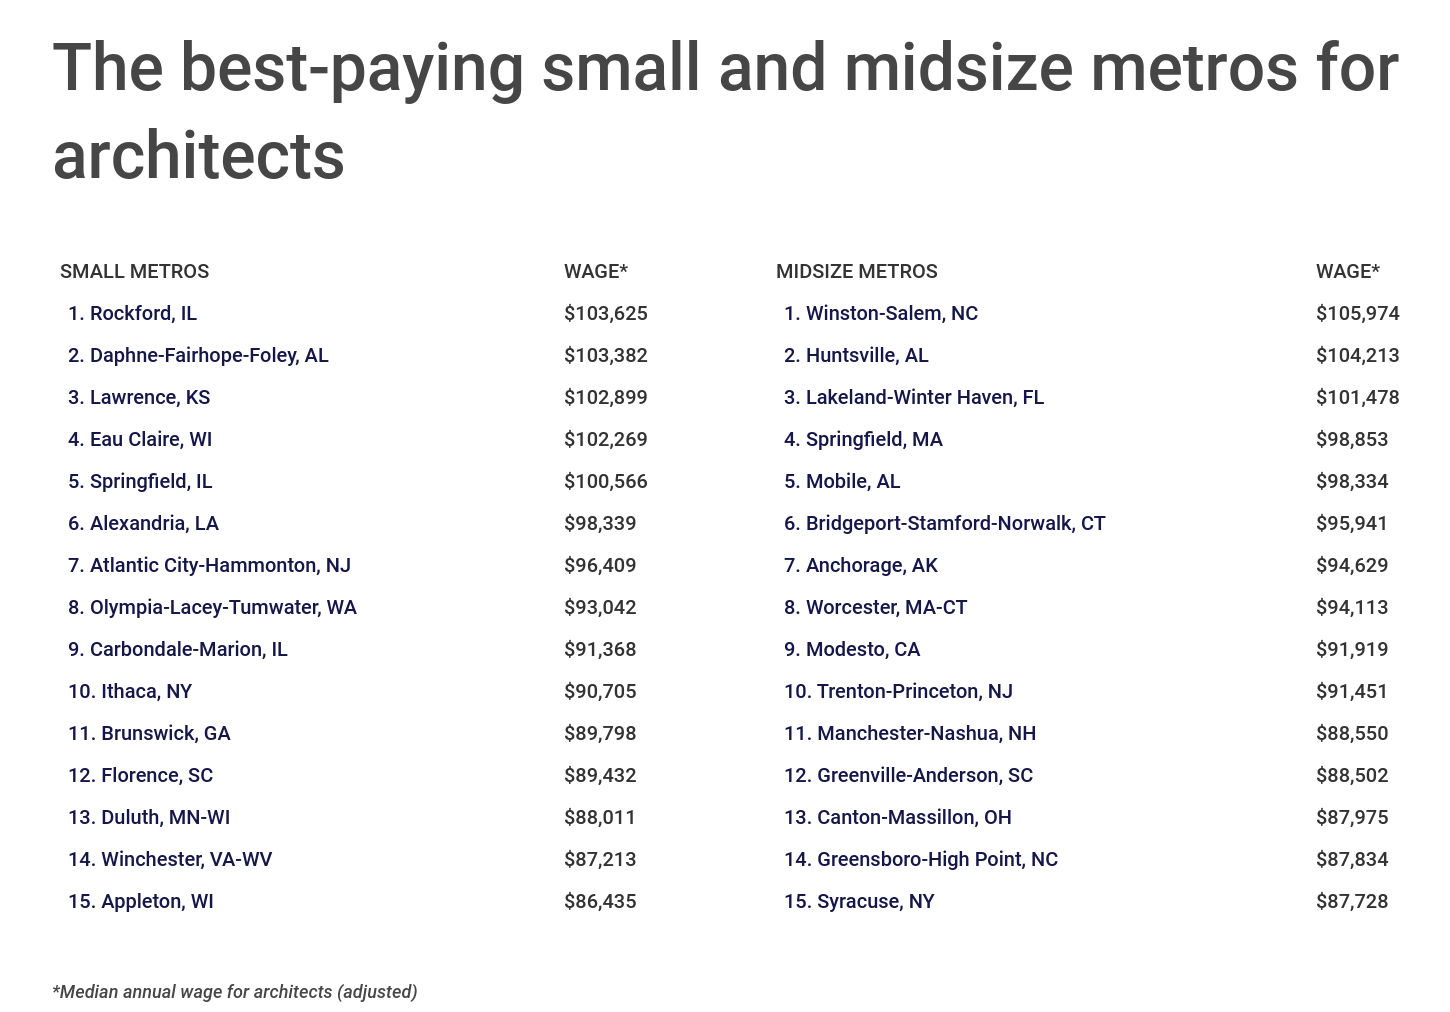
To determine the best-paying locations for architects, researchers at Construction Coverage analyzed the latest data from the U.S. Bureau of Labor Statistics and the U.S. Bureau of Economic Analysis. The researchers ranked metro areas according to the median annual wage for architects adjusted for local cost-of-living differences. In the event of a tie, the metro with the higher unadjusted median annual wage for architects was ranked higher.
Here are the best-paying U.S. metropolitan areas for architects.
The Best-Paying Large Metros for Architects

Photo Credit: Sean Pavone / Shutterstock
15. New Orleans-Metairie, LA
- Median annual wage for architects (adjusted): $84,886
- Median annual wage for architects (actual): $82,220
- Median annual wage for all occupations (actual): $38,060
- Concentration of architects (compared to average): +19%

Photo Credit: The Speedy Butterfly / Shutterstock
14. Memphis, TN-MS-AR
- Median annual wage for architects (adjusted): $84,902
- Median annual wage for architects (actual): $78,720
- Median annual wage for all occupations (actual): $37,790
- Concentration of architects (compared to average): -30%
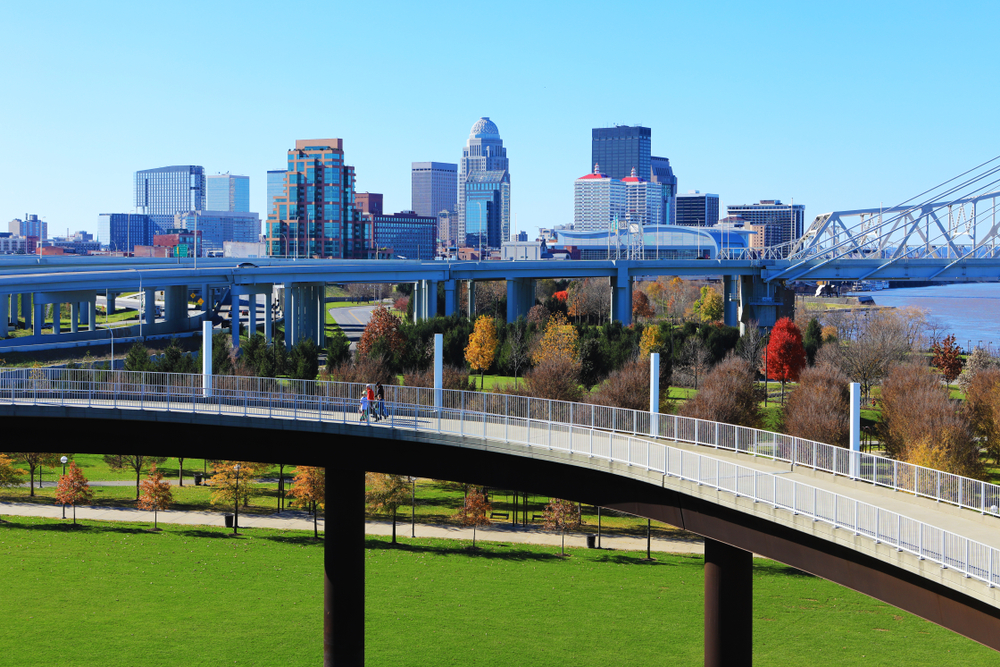
Photo Credit: Harold Stiver / Shutterstock
13. Louisville/Jefferson County, KY-IN
- Median annual wage for architects (adjusted): $85,018
- Median annual wage for architects (actual): $78,140
- Median annual wage for all occupations (actual): $38,740
- Concentration of architects (compared to average): -42%

Photo Credit: Jon Bilous / Shutterstock
12. Charlotte-Concord-Gastonia, NC-SC
- Median annual wage for architects (adjusted): $85,049
- Median annual wage for architects (actual): $80,440
- Median annual wage for all occupations (actual): $45,250
- Concentration of architects (compared to average): +31%

Photo Credit: yhelfman / Shutterstock
11. San Francisco-Oakland-Berkeley, CA
- Median annual wage for architects (adjusted): $85,065
- Median annual wage for architects (actual): $99,840
- Median annual wage for all occupations (actual): $62,000
- Concentration of architects (compared to average): +156%

Photo Credit: William Perugini / Shutterstock
10. New York-Newark-Jersey City, NY-NJ-PA
- Median annual wage for architects (adjusted): $85,326
- Median annual wage for architects (actual): $98,530
- Median annual wage for all occupations (actual): $55,810
- Concentration of architects (compared to average): +73%
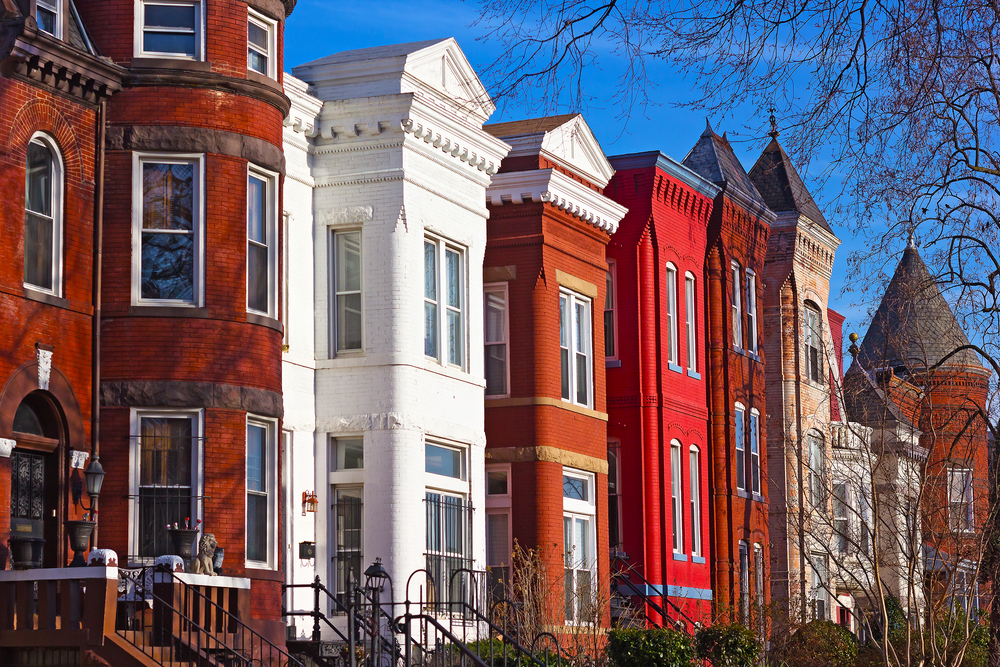
Photo Credit: Andrei Medvedev / Shutterstock
9. Washington-Arlington-Alexandria, DC-VA-MD-WV
- Median annual wage for architects (adjusted): $86,540
- Median annual wage for architects (actual): $96,520
- Median annual wage for all occupations (actual): $61,630
- Concentration of architects (compared to average): +58%

Photo Credit: CK Foto / Shutterstock
8. Dallas-Fort Worth-Arlington, TX
- Median annual wage for architects (adjusted): $88,272
- Median annual wage for architects (actual): $92,740
- Median annual wage for all occupations (actual): $45,470
- Concentration of architects (compared to average): +7%

Photo Credit: thetahoeguy / Shutterstock
7. San Jose-Sunnyvale-Santa Clara, CA
- Median annual wage for architects (adjusted): $88,573
- Median annual wage for architects (actual): $99,310
- Median annual wage for all occupations (actual): $75,510
- Concentration of architects (compared to average): -16%

Photo Credit: eskystudio / Shutterstock
6. Boston-Cambridge-Newton, MA-NH
- Median annual wage for architects (adjusted): $90,357
- Median annual wage for architects (actual): $99,590
- Median annual wage for all occupations (actual): $60,590
- Concentration of architects (compared to average): +67%
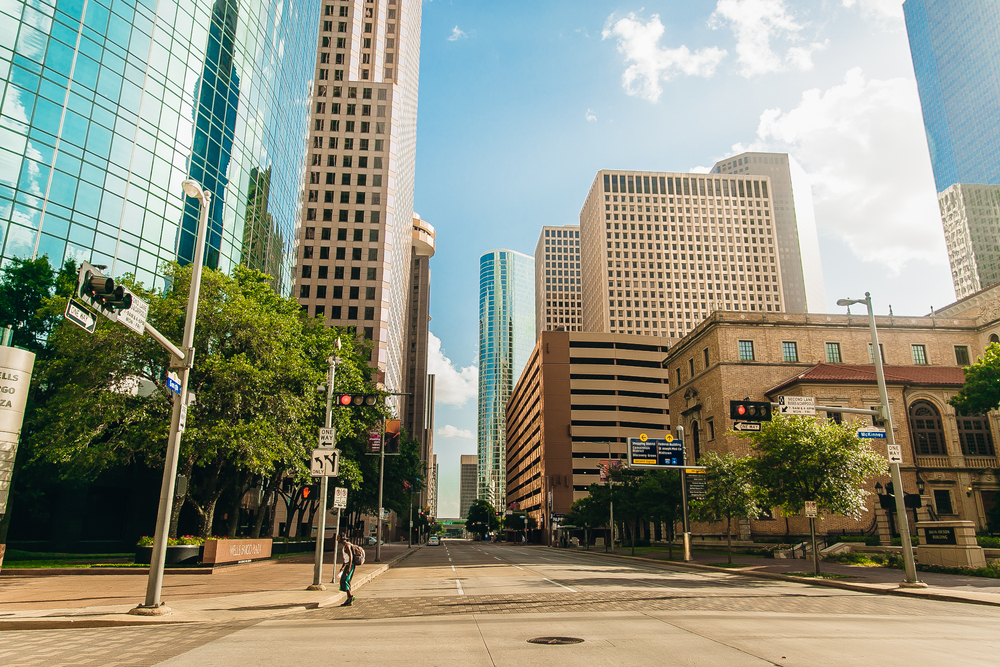
Photo Credit: Tomas Simkus / Shutterstock
5. Houston-The Woodlands-Sugar Land, TX
- Median annual wage for architects (adjusted): $92,041
- Median annual wage for architects (actual): $92,110
- Median annual wage for all occupations (actual): $44,630
- Concentration of architects (compared to average): -22%

Photo Credit: Andriy Blokhin / Shutterstock
4. Sacramento-Roseville-Folsom, CA
- Median annual wage for architects (adjusted): $92,990
- Median annual wage for architects (actual): $98,660
- Median annual wage for all occupations (actual): $48,570
- Concentration of architects (compared to average): -4%
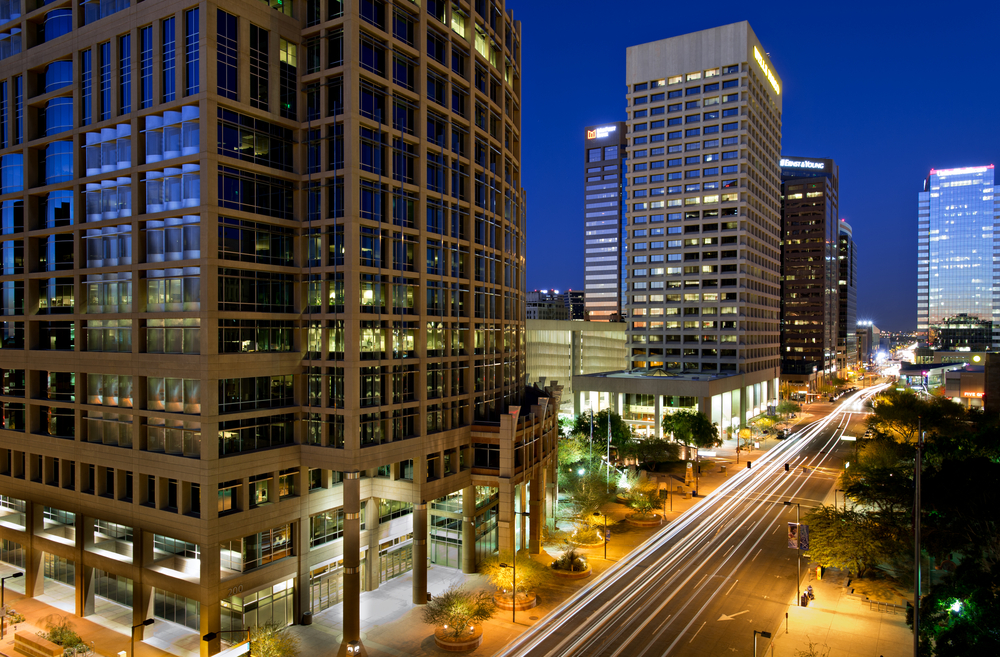
Photo Credit: Mark Skalny / Shutterstock
3. Phoenix-Mesa-Chandler, AZ
- Median annual wage for architects (adjusted): $96,170
- Median annual wage for architects (actual): $98,630
- Median annual wage for all occupations (actual): $45,570
- Concentration of architects (compared to average): -30%

Photo Credit: LHBLLC / Shutterstock
2. Tucson, AZ
- Median annual wage for architects (adjusted): $96,907
- Median annual wage for architects (actual): $90,920
- Median annual wage for all occupations (actual): $38,050
- Concentration of architects (compared to average): -59%

Photo Credit: Rob Hainer / Shutterstock
1. Birmingham-Hoover, AL
- Median annual wage for architects (adjusted): $108,683
- Median annual wage for architects (actual): $100,690
- Median annual wage for all occupations (actual): $38,400
- Concentration of architects (compared to average): +13%
Detailed Findings & Methodology
To determine best-paying locations for architects, researchers at Construction Coverage analyzed the latest data from the U.S. Bureau of Labor Statistics Occupational Employment and Wage Statistics and the U.S. Bureau of Economic Analysis Regional Price Parities datasets. The researchers ranked metro areas according to the median annual wage for architects adjusted for local cost-of-living differences. In the event of a tie, the metro with the higher unadjusted median annual wage for architects was ranked higher. Median annual wage for all occupations and the concentration of architects (compared to average) were also calculated. Total employment data used in the analysis excludes self-employed workers.
Only metropolitan areas with at least 100,000 people were included in the analysis. Additionally, metro areas were grouped into the following cohorts based on population size:
- Small metros: 100,000-349,999
- Midsize metros: 350,000-999,999
- Large metros: 1,000,000 or more