American Cities Where Home Prices Are Still Below Their Pre-Great Recession Peak [2022 Edition]
The residential real estate market in the U.S. experienced an unprecedented spike in home prices between 2020 and 2022, but signs from this spring and summer indicate that the market is cooling off.
Existing home sales in the U.S. have declined for five straight months, including a 5.4% dip in June. Inventory has been increasing while mortgage applications decline as more buyers are priced out by higher prices and rising interest rates. And with the buyers regaining power in the market, houses are staying on the market longer, the rate of home price growth has slowed, and more sellers are lowering prices.
The rapid rise in prices over the last two years and the current slowing of the market has invoked memories of the housing crash of the mid-2000s for many homebuyers and homeowners. A survey earlier this year found that more than three in four buyers and sellers believed that the U.S. was in the midst of a housing bubble.
Despite these concerns, however, a recent Zillow survey found that 60% of real estate experts believe that recent conditions in the housing market have not produced a bubble. Instead, the experts report that market fundamentals and stronger mortgage lending practices have limited the risk of a bubble. While price growth may continue to slow, the type of major correction seen in the mid-2000s is considered unlikely.
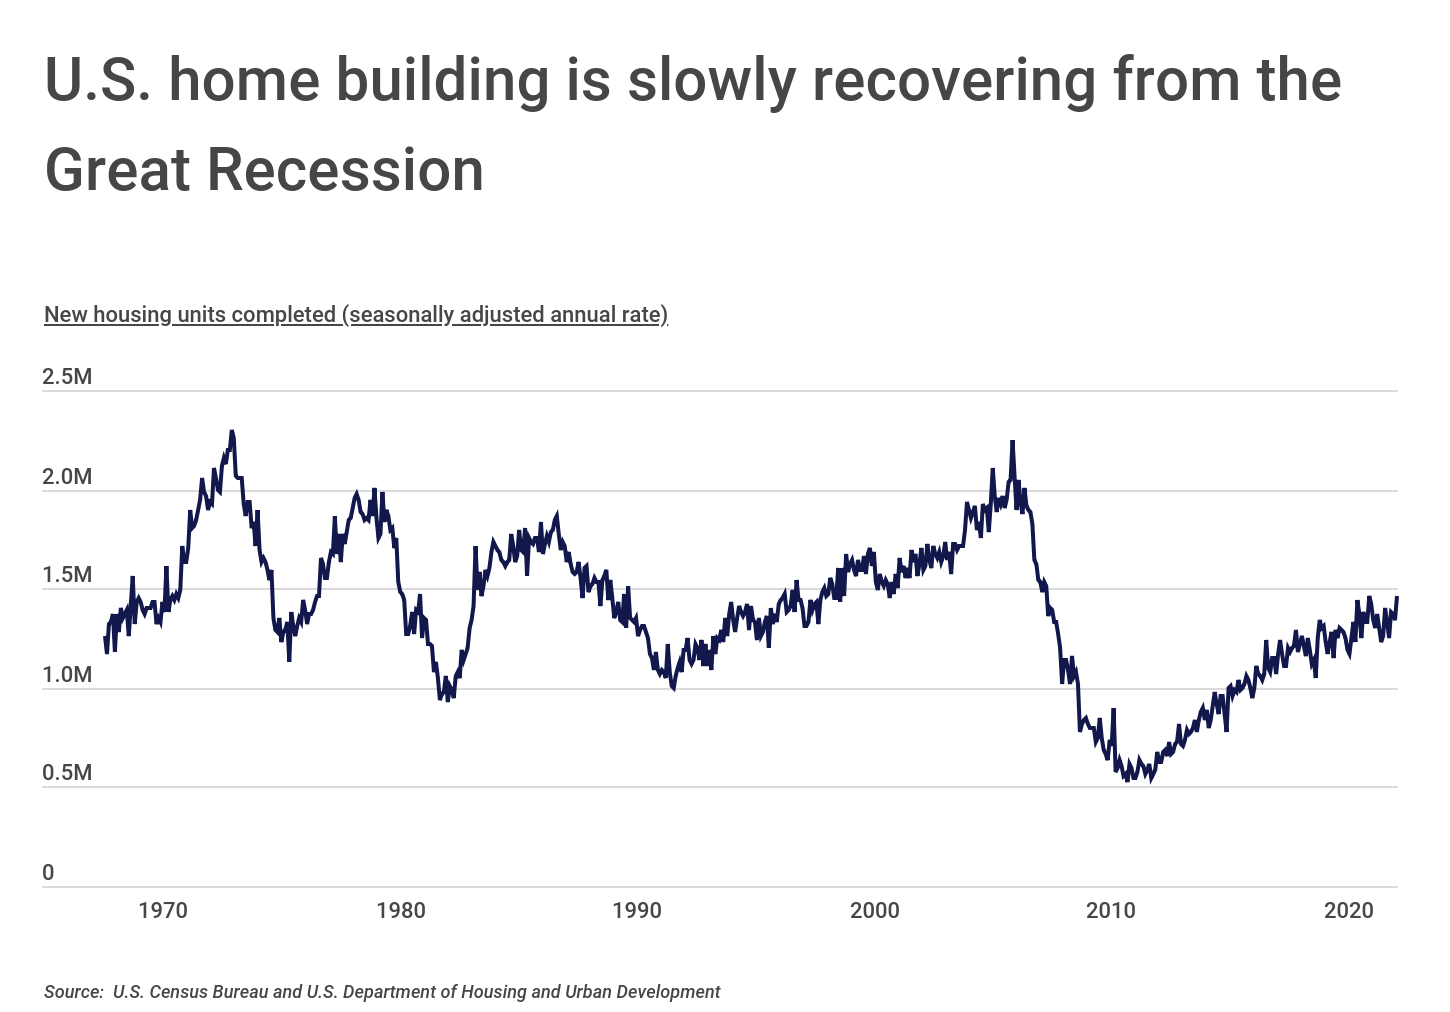
In fact, one of the conditions that has contributed to the current housing boom is a product of the last crash: low inventory. When the collapse of the housing market set off the Great Recession, the construction industry suffered major losses. Many home builders faced steep revenue declines or were wiped out altogether.
RELATED
Investing in home improvements is one of the best ways to increase the value of your home. When doing a more extensive remodel, make sure you have builders risk insurance since your homeowner’s policy usually won’t apply when the house is under construction. The same is true for commercial properties, where most commercial property policies have exclusions for construction work.
As a result, the seasonally-adjusted annual rate of new housing completions fell from a high of more than 2.2 million in March 2006 to a low of 520,000 in January 2011. Over the decade since, completions were slow to recover to typical historic levels and today sit around two-thirds of the mid-2000s peak. With less new stock coming on the market, buyers have been forced to compete for limited inventory. And the potential recession on the horizon could continue to limit how quickly builders add new units in the next few years.
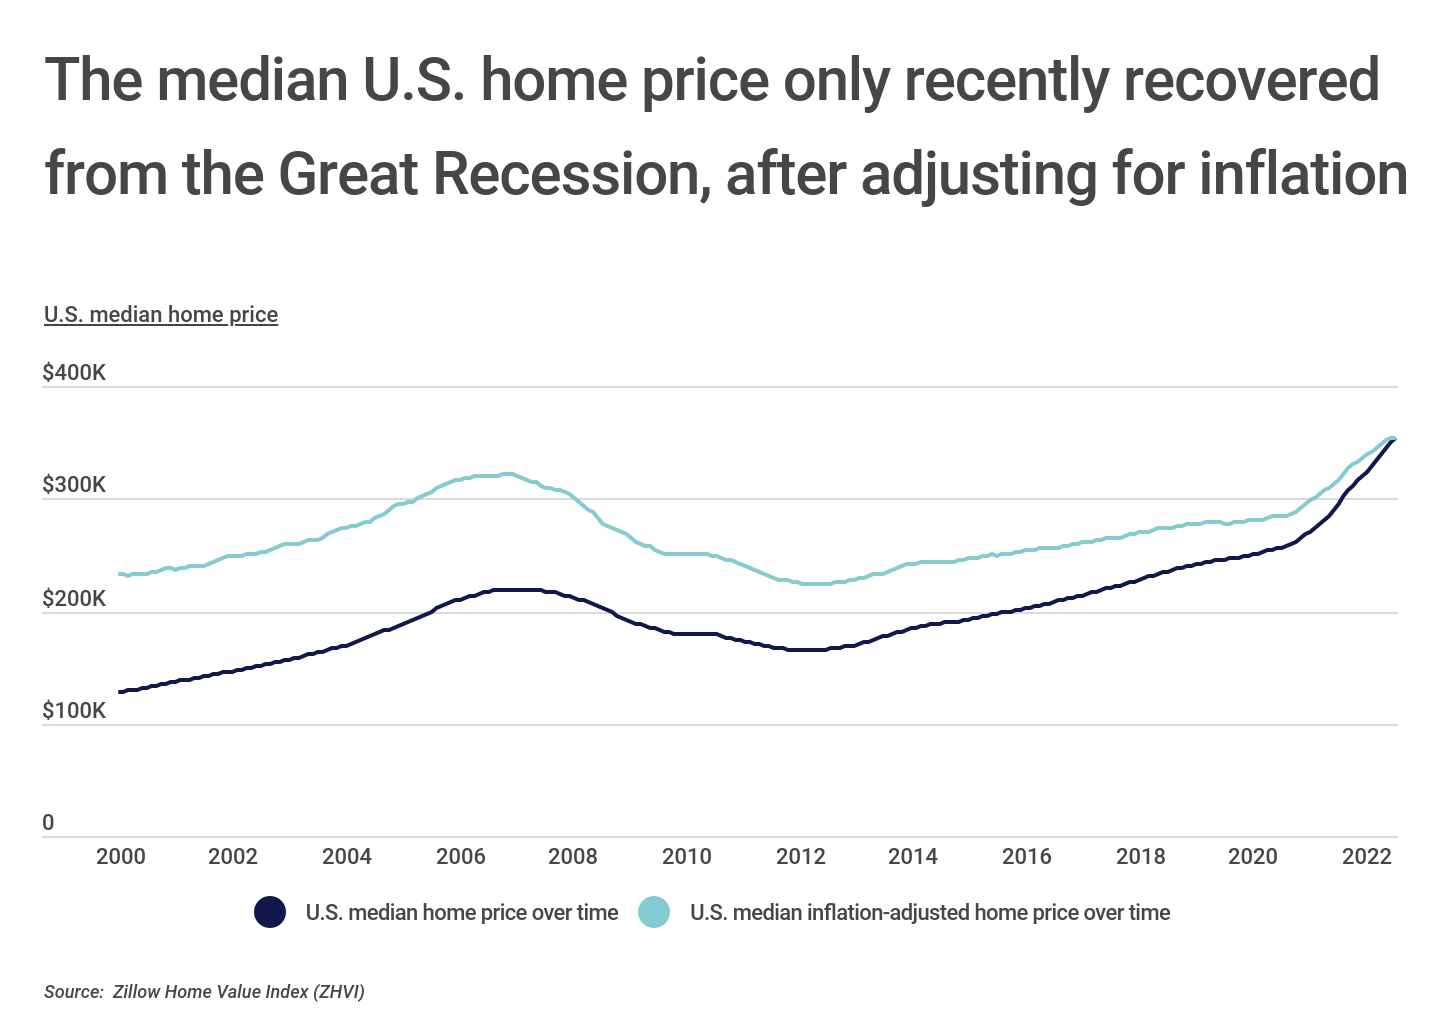
Housing market experts also note that while prices have risen sharply in the last two years, the increases are not excessive in light of historical trends and inflation. After the housing crash, it took a decade for the median home price in the U.S. to catch up to its previous peak in nominal dollars. But when factoring in the rate of inflation over time, home prices did not match their pre-Great Recession peak until the middle of 2021.
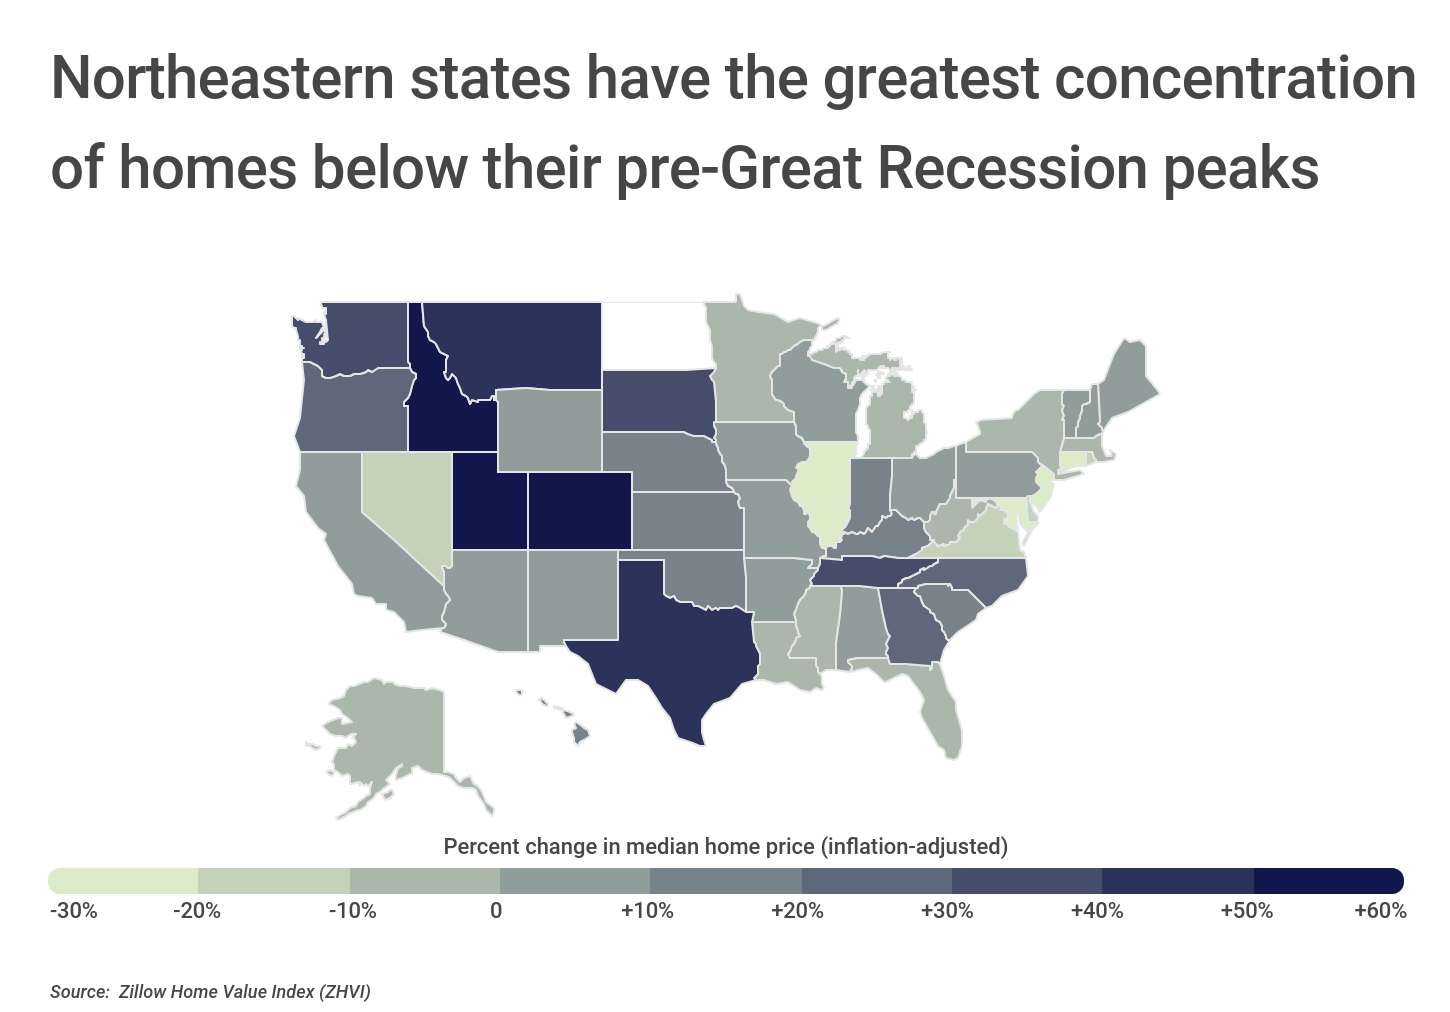
And in some markets, inflation-adjusted home prices still have not recovered to their pre-recession levels. While growing locations in the Mountain West and Sun Belt have continued to see home values increase, 17 states have a median inflation-adjusted home price below the pre-recession peak. These states are largely concentrated in the Northeast, led by Connecticut and Maryland, the only two states where current prices lag their previous peak by more than 25%.
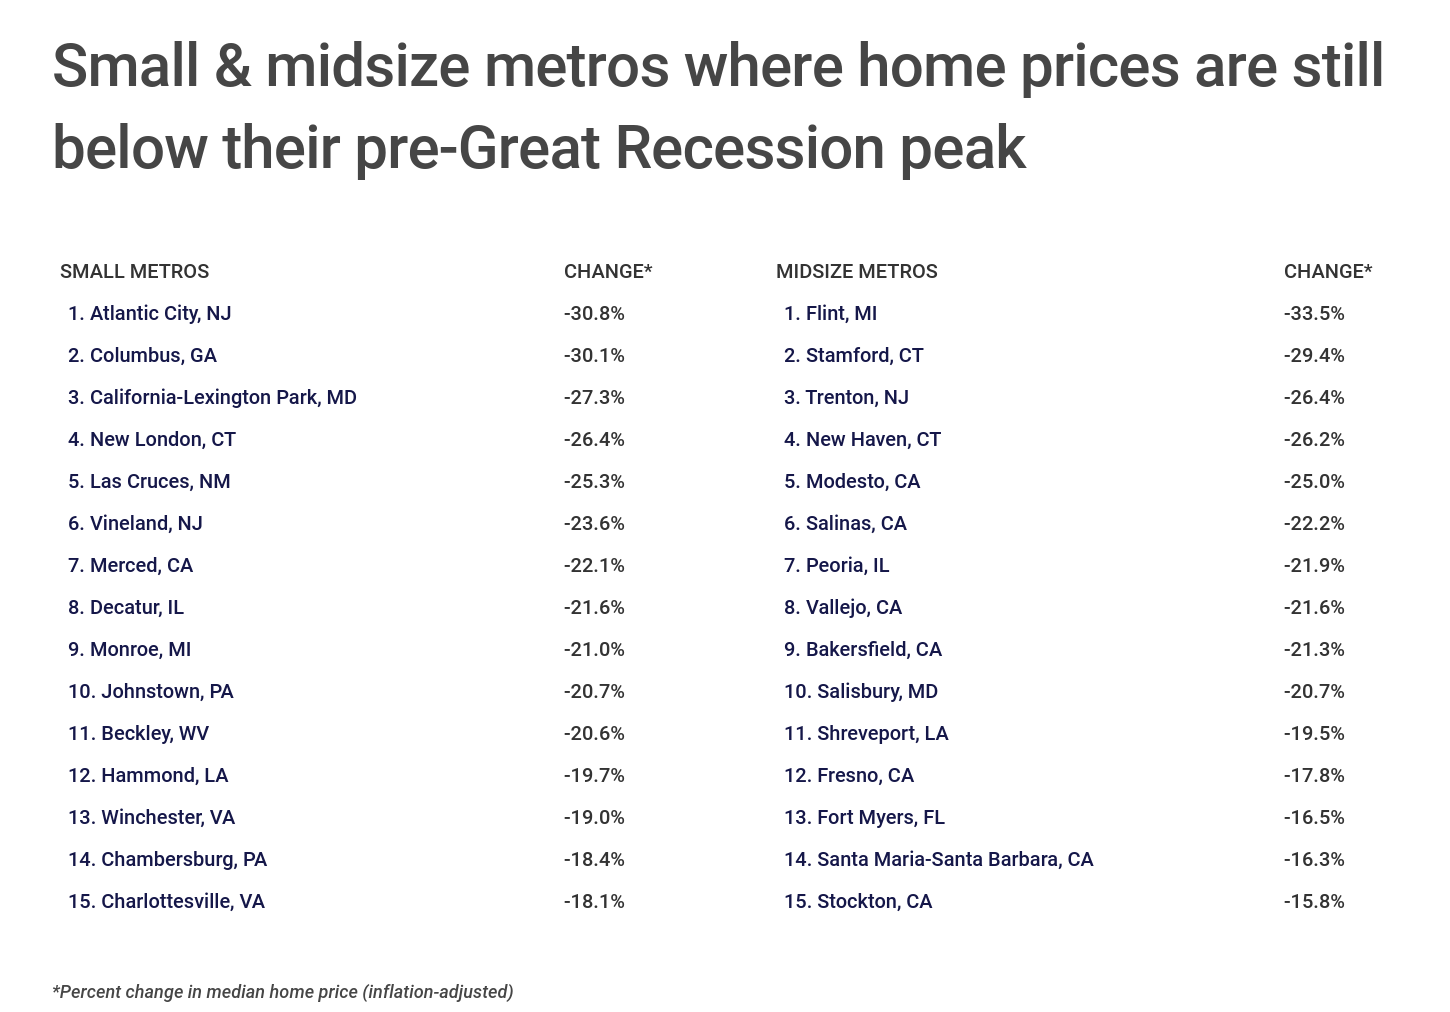
At the metro level, locations where homes are below the pre-Great Recession peak are more widely distributed across the country. In certain Rust Belt and the northeastern cities, slow or negative population growth has limited demand and kept price growth relatively low. But elsewhere, in fast-growing markets in Florida, Nevada, and Arizona, pre-Great Recession home prices were most overinflated and prices have had further to go in recovery.
The data used in this analysis is from Zillow’s Housing Data. To determine the locations where home prices are still below their pre-Great Recession peak, researchers at Construction Coverage calculated the inflation-adjusted percentage change in median home price between June 2022 and the peak month prior to December 2007. In the event of a tie, the location with the lower total change in median home price (inflation-adjusted) was ranked higher. To improve relevance, only metropolitan areas with at least 100,000 residents were included. Additionally, metros were grouped into cohorts based on population size: small (100,000-349,999), midsize (350,000-999,999), and large (1,000,000 or more).
Here are the U.S. metropolitan areas where home prices are still below their pre-Great Recession peak.
Large Metros Where Home Prices Are Still Below Their Pre-Great Recession Peak

Photo Credit: Checubus / Shutterstock
15. Minneapolis-St Paul, MN
- Percent change in median home price (inflation-adjusted): -6.1%
- Total change in median home price (inflation-adjusted): -$24,479
- Current median home price (2022 dollars): $379,145
- Pre-2008 peak median home price (2022 dollars): $403,624
- Pre-2008 peak median home price (unadjusted dollars): $265,988
- Pre-2008 peak date: December 2005

Photo Credit: LHBLLC / Shutterstock
14. Tucson, AZ
- Percent change in median home price (inflation-adjusted): -6.5%
- Total change in median home price (inflation-adjusted): -$24,002
- Current median home price (2022 dollars): $347,181
- Pre-2008 peak median home price (2022 dollars): $371,183
- Pre-2008 peak median home price (unadjusted dollars): $249,435
- Pre-2008 peak date: May 2006

Photo Credit: Feoktistoff / Shutterstock
13. Sacramento, CA
- Percent change in median home price (inflation-adjusted): -8.1%
- Total change in median home price (inflation-adjusted): -$55,097
- Current median home price (2022 dollars): $626,326
- Pre-2008 peak median home price (2022 dollars): $681,423
- Pre-2008 peak median home price (unadjusted dollars): $449,058
- Pre-2008 peak date: December 2005

Photo Credit: Just dance / Shutterstock
12. Miami-Fort Lauderdale, FL
- Percent change in median home price (inflation-adjusted): -8.2%
- Total change in median home price (inflation-adjusted): -$40,729
- Current median home price (2022 dollars): $456,489
- Pre-2008 peak median home price (2022 dollars): $497,218
- Pre-2008 peak median home price (unadjusted dollars): $338,108
- Pre-2008 peak date: November 2006

Photo Credit: Sean Pavone / Shutterstock
11. Cleveland, OH
- Percent change in median home price (inflation-adjusted): -9.2%
- Total change in median home price (inflation-adjusted): -$22,362
- Current median home price (2022 dollars): $219,635
- Pre-2008 peak median home price (2022 dollars): $241,997
- Pre-2008 peak median home price (unadjusted dollars): $153,426
- Pre-2008 peak date: December 2004

Photo Credit: Gang Liu / Shutterstock
10. Philadelphia, PA
- Percent change in median home price (inflation-adjusted): -10.1%
- Total change in median home price (inflation-adjusted): -$37,912
- Current median home price (2022 dollars): $336,380
- Pre-2008 peak median home price (2022 dollars): $374,292
- Pre-2008 peak median home price (unadjusted dollars): $254,144
- Pre-2008 peak date: October 2006

Photo Credit: ESB Professional / Shutterstock
9. Providence, RI
- Percent change in median home price (inflation-adjusted): -11.9%
- Total change in median home price (inflation-adjusted): -$60,790
- Current median home price (2022 dollars): $449,970
- Pre-2008 peak median home price (2022 dollars): $510,760
- Pre-2008 peak median home price (unadjusted dollars): $336,591
- Pre-2008 peak date: December 2005
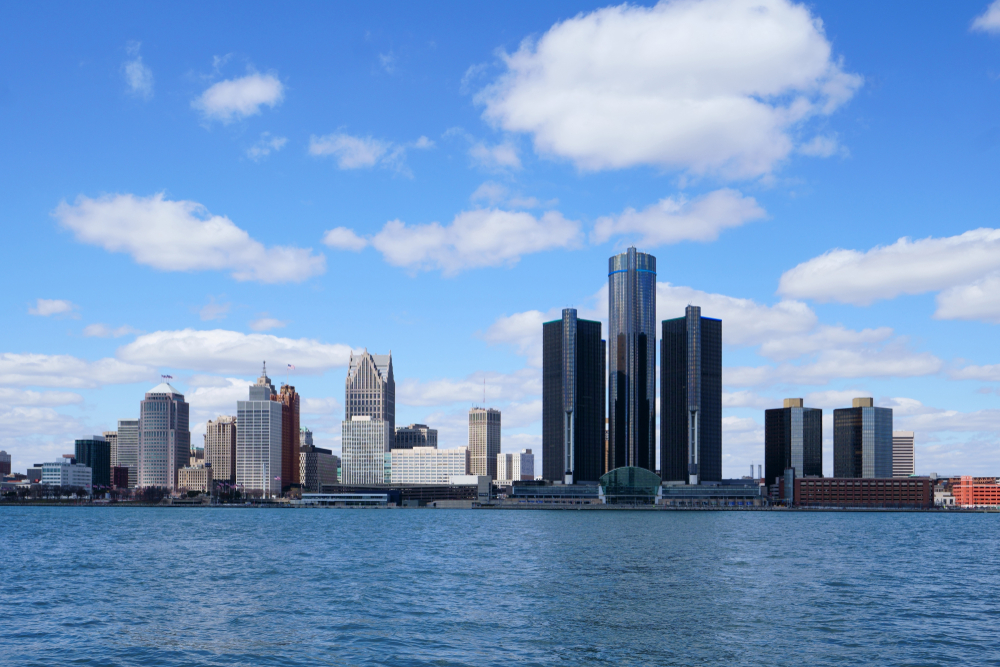
Photo Credit: Studio Specialty / Shutterstock
8. Detroit, MI
- Percent change in median home price (inflation-adjusted): -13.0%
- Total change in median home price (inflation-adjusted): -$36,393
- Current median home price (2022 dollars): $243,922
- Pre-2008 peak median home price (2022 dollars): $280,315
- Pre-2008 peak median home price (unadjusted dollars): $172,394
- Pre-2008 peak date: December 2003

Photo Credit: Alexandr Junek Imaging / Shutterstock
7. Virginia Beach, VA
- Percent change in median home price (inflation-adjusted): -14.5%
- Total change in median home price (inflation-adjusted): -$55,225
- Current median home price (2022 dollars): $325,380
- Pre-2008 peak median home price (2022 dollars): $380,605
- Pre-2008 peak median home price (unadjusted dollars): $259,192
- Pre-2008 peak date: December 2006

Photo Credit: dibrova / Shutterstock
6. New York, NY
- Percent change in median home price (inflation-adjusted): -14.7%
- Total change in median home price (inflation-adjusted): -$105,854
- Current median home price (2022 dollars): $614,826
- Pre-2008 peak median home price (2022 dollars): $720,680
- Pre-2008 peak median home price (unadjusted dollars): $484,297
- Pre-2008 peak date: May 2006
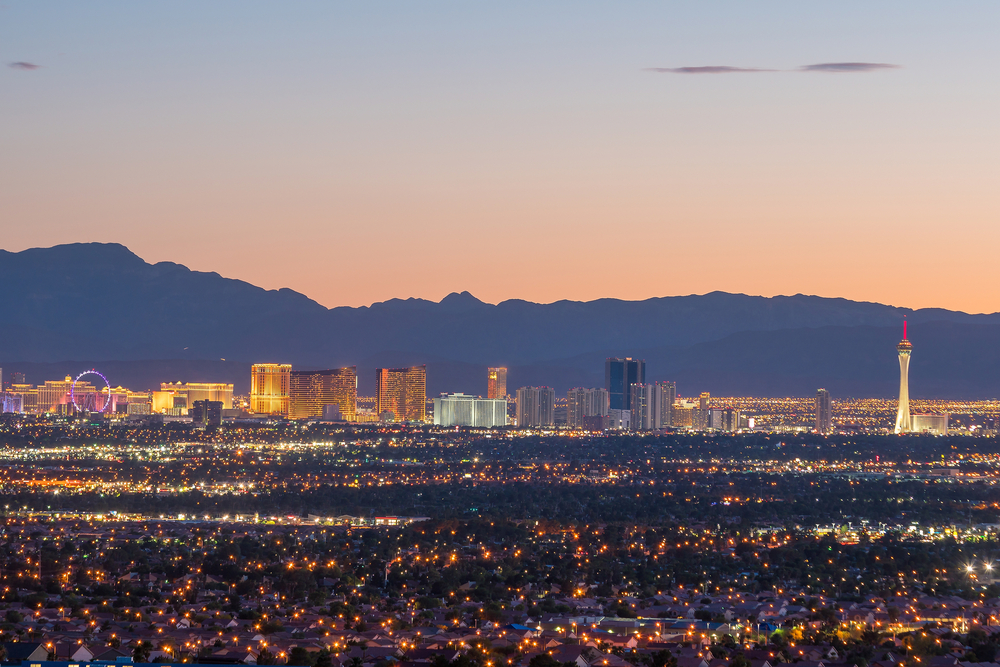
Photo Credit: f11photo / Shutterstock
5. Las Vegas, NV
- Percent change in median home price (inflation-adjusted): -15.4%
- Total change in median home price (inflation-adjusted): -$82,677
- Current median home price (2022 dollars): $453,682
- Pre-2008 peak median home price (2022 dollars): $536,359
- Pre-2008 peak median home price (unadjusted dollars): $360,433
- Pre-2008 peak date: May 2006

Photo Credit: A G Baxter / Shutterstock
4. Washington, DC
- Percent change in median home price (inflation-adjusted): -20.3%
- Total change in median home price (inflation-adjusted): -$141,503
- Current median home price (2022 dollars): $556,296
- Pre-2008 peak median home price (2022 dollars): $697,799
- Pre-2008 peak median home price (unadjusted dollars): $468,921
- Pre-2008 peak date: May 2006

Photo Credit: NayaDadara / Shutterstock
3. Hartford, CT
- Percent change in median home price (inflation-adjusted): -22.6%
- Total change in median home price (inflation-adjusted): -$94,250
- Current median home price (2022 dollars): $322,838
- Pre-2008 peak median home price (2022 dollars): $417,088
- Pre-2008 peak median home price (unadjusted dollars): $283,203
- Pre-2008 peak date: October 2006

Photo Credit: Felix Mizioznikov / Shutterstock
2. Chicago, IL
- Percent change in median home price (inflation-adjusted): -23.7%
- Total change in median home price (inflation-adjusted): -$97,145
- Current median home price (2022 dollars): $312,752
- Pre-2008 peak median home price (2022 dollars): $409,897
- Pre-2008 peak median home price (unadjusted dollars): $275,451
- Pre-2008 peak date: May 2006

Photo Credit: Jon Bilous / Shutterstock
1. Baltimore, MD
- Percent change in median home price (inflation-adjusted): -24.6%
- Total change in median home price (inflation-adjusted): -$122,761
- Current median home price (2022 dollars): $377,062
- Pre-2008 peak median home price (2022 dollars): $499,823
- Pre-2008 peak median home price (unadjusted dollars): $339,380
- Pre-2008 peak date: October 2006
Detailed Findings & Methodology
The data used in this analysis is from Zillow’s Housing Data. To determine the locations where home prices are still below their pre-Great Recession peak, researchers at Construction Coverage calculated the inflation-adjusted percentage change in median home price between June 2022 and the peak month prior to December 2007. In the event of a tie, the location with the lower total change in median home price (inflation-adjusted) was ranked higher. To improve relevance, only metropolitan areas with at least 100,000 residents were included. Additionally, metros were grouped into cohorts based on population size: small (100,000-349,999), midsize (350,000-999,999), and large (1,000,000 or more).