
Cities Where the Construction Industry Depends Most on Foreign Workers
As federal immigration enforcement intensifies, industries that depend heavily on foreign-born workers are beginning to feel the strain. One of the most exposed is the U.S. construction sector, where immigrants—both documented and undocumented—make up a substantial share of the workforce. These workers are integral not only to residential and commercial building projects, but also to the maintenance and repair of the nation’s aging infrastructure.
Recent data reveal that in several major U.S. cities, foreign-born workers account for more than half of all construction industry employment. These concentrations are especially notable in parts of the country with large immigrant populations, long-standing labor pipelines, or occupational niches historically filled by foreign workers. As immigration enforcement measures ramp up, these metro areas may face disproportionate labor disruptions, with potential consequences for timelines, costs, and the broader economy.
Key Statistics: Immigrant Labor in the U.S. Construction Industry
- The construction industry has a growing reliance on foreign-born employees. The share of foreign-born workers in the construction industry has trended upward for more than a decade, rebounding after the Great Recession and reaching 26% nationally.
- Immigrant employees make up a majority of the construction industry workforce in several major metros. In cities like Miami, Los Angeles, DC, and Houston, more than half of all construction industry employees are immigrants.
- Drywallers, roofers, and painters are most likely to be foreign-born. More than half of employees in each of these construction-related occupations are immigrants—far above the overall industry average.
Historical Trends: Growth of Foreign-Born Workers in Construction (2009–2025)
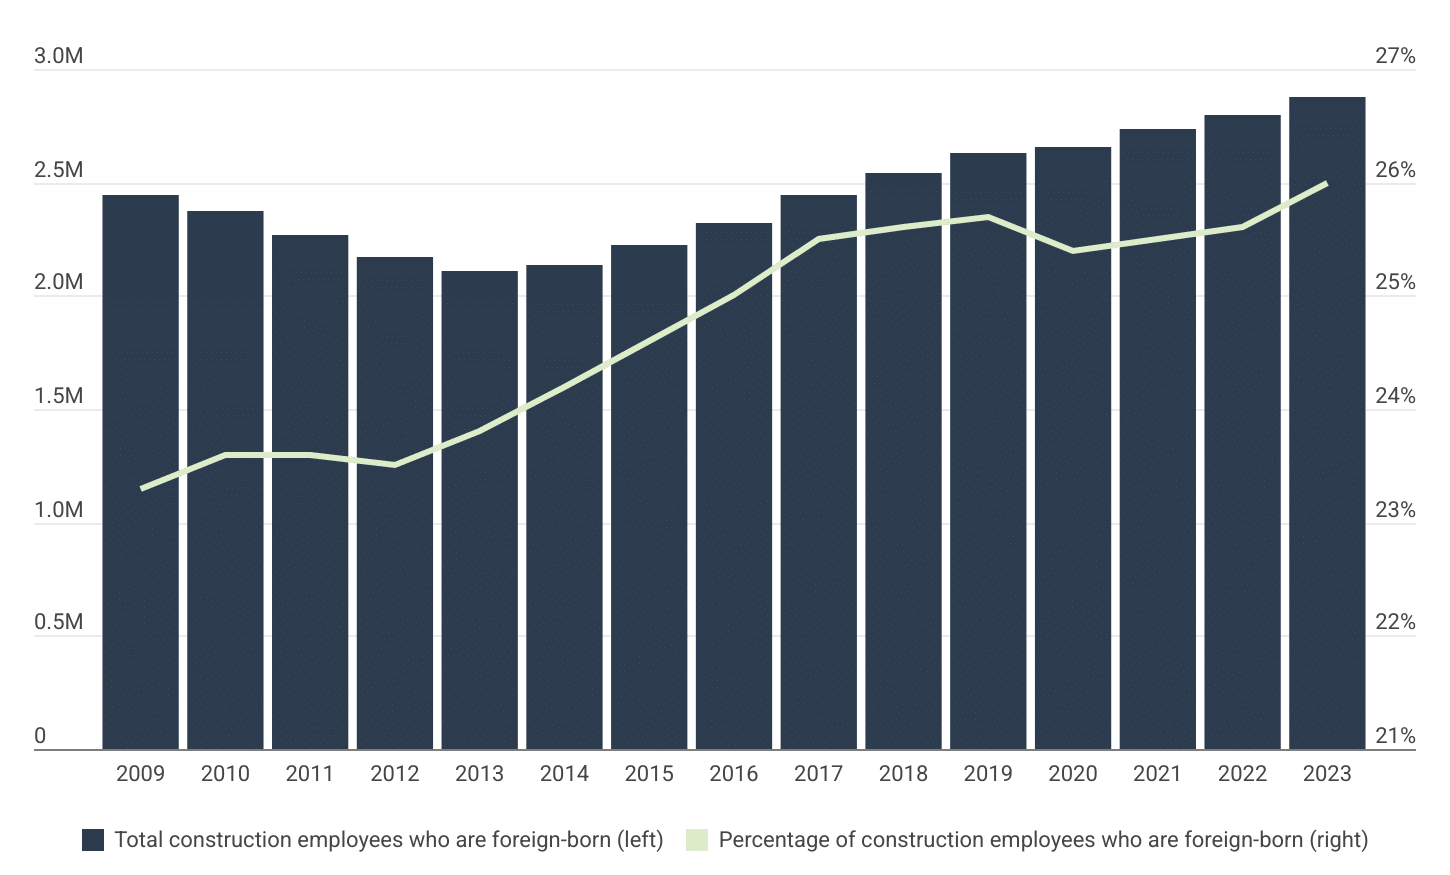
With nearly 2.9 million immigrants employed, the construction industry is increasingly made up of foreign-born workers
Data: Foreign-Born Construction Industry Employment Time Series
| Year | Total foreign-born employment | Foreign-born employment share |
|---|---|---|
| 2009 | 2,443,883 | 23.3% |
| 2010 | 2,376,548 | 23.6% |
| 2011 | 2,271,770 | 23.6% |
| 2012 | 2,169,577 | 23.5% |
| 2013 | 2,112,364 | 23.8% |
| 2014 | 2,139,427 | 24.2% |
| 2015 | 2,221,697 | 24.6% |
| 2016 | 2,317,551 | 25.0% |
| 2017 | 2,442,213 | 25.5% |
| 2018 | 2,537,197 | 25.6% |
| 2019 | 2,627,394 | 25.7% |
| 2020 | 2,657,558 | 25.4% |
| 2021 | 2,734,133 | 25.5% |
| 2022 | 2,797,064 | 25.6% |
| 2023 | 2,879,267 | 26.0% |
The construction industry workforce includes a wide range of occupations—from traditional roles like construction laborers, plumbers, and carpenters to support roles such as office clerks, accountants, and company executives. Across this full spectrum of construction industry employment, the share of foreign-born workers has steadily increased for more than a decade.
In 2009, immigrants made up 23.3% of all construction industry employees. That share has grown nearly every year since, reaching 26.0% by 2023. Over the same period, the total number of foreign-born employees in the construction sector rose by more than 435,000, from over 2.4 million to nearly 2.9 million. This suggests a gradual but sustained increase in the industry’s reliance on foreign-born workers—a shift that continued through the economic recovery after the Great Recession and into the post-pandemic construction boom.
Streamline labor management in construction
Navigating a workforce where foreign-born employees make up half of some metro construction industries can be challenging. Discover the right construction project management software to coordinate labor, stay on schedule, and optimize productivity across diverse teams—helping your projects run smoothly despite shifting labor dynamics.
Construction Trades With the Highest Concentration of Immigrant Workers
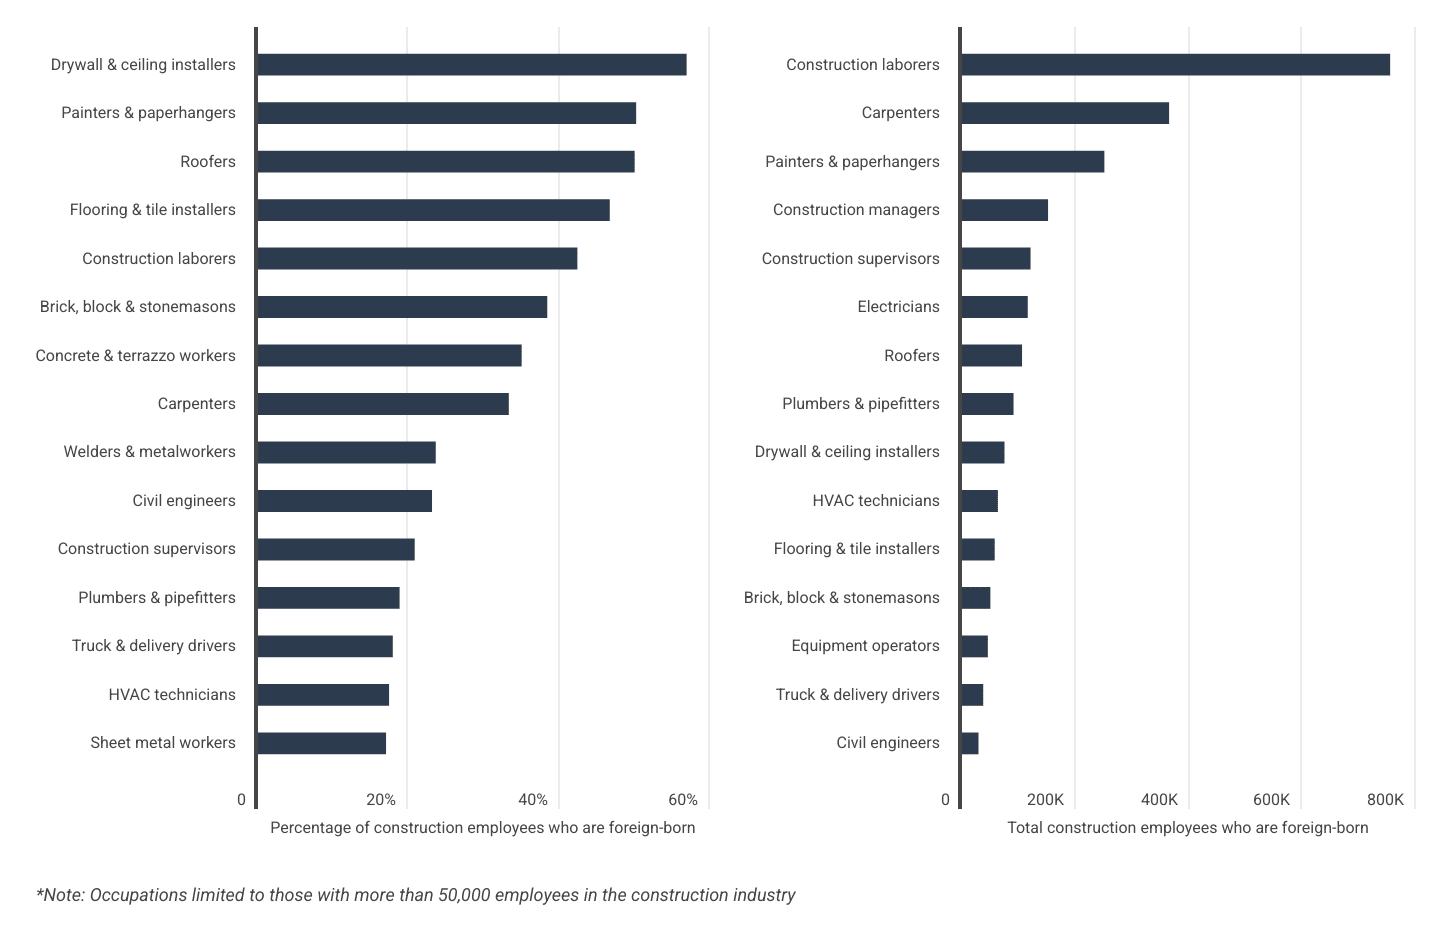
While over 750,000 U.S. construction laborers are foreign-born, 56.9% of drywallers are immigrants
Data: Foreign-Born Construction Employment by Occupation
| Occupation | Foreign-born employment share |
|---|---|
| Drywall & ceiling installers | 56.9% |
| Painters & paperhangers | 50.2% |
| Roofers | 50.0% |
| Flooring & tile installers | 46.7% |
| Construction laborers | 42.4% |
| Brick, block & stonemasons | 38.4% |
| Concrete & terrazzo workers | 35.0% |
| Carpenters | 33.3% |
| Welders & metalworkers | 23.6% |
| Civil engineers | 23.1% |
| Construction supervisors | 20.8% |
| Plumbers & pipefitters | 18.8% |
| Truck & delivery drivers | 17.9% |
| HVAC technicians | 17.4% |
| Sheet metal workers | 17.0% |
| Occupation | Total foreign-born employment |
|---|---|
| Construction laborers | 754,476 |
| Carpenters | 364,941 |
| Painters & paperhangers | 250,940 |
| Construction managers | 151,655 |
| Construction supervisors | 120,856 |
| Electricians | 115,821 |
| Roofers | 105,806 |
| Plumbers & pipefitters | 90,874 |
| Drywall & ceiling installers | 74,830 |
| HVAC technicians | 63,262 |
| Flooring & tile installers | 57,631 |
| Brick, block & stonemasons | 50,012 |
| Equipment operators | 45,602 |
| Truck & delivery drivers | 37,391 |
| Civil engineers | 29,036 |
Some of the most essential construction occupations are also the most reliant on foreign-born labor. There are three occupation groups where foreign-born workers make up a majority of the workforce: drywall and ceiling installers (56.9%), painters and paperhangers (50.2%), and roofers (50.0%). Other high-dependence trades include flooring and tile installers (46.7%) and construction laborers (42.4%). These roles represent a large portion of on-site construction work and are among the most physically intensive occupations in the industry.
By total headcount, the largest group of foreign-born employees are construction laborers, with 754,476 immigrant workers nationwide. Carpenters (364,941) and painters and paperhangers (250,940) also account for a significant portion of the workforce. These figures highlight both the concentration and scale of immigrant employment in key construction trades.
State Differences: Reliance on Foreign Labor in Construction
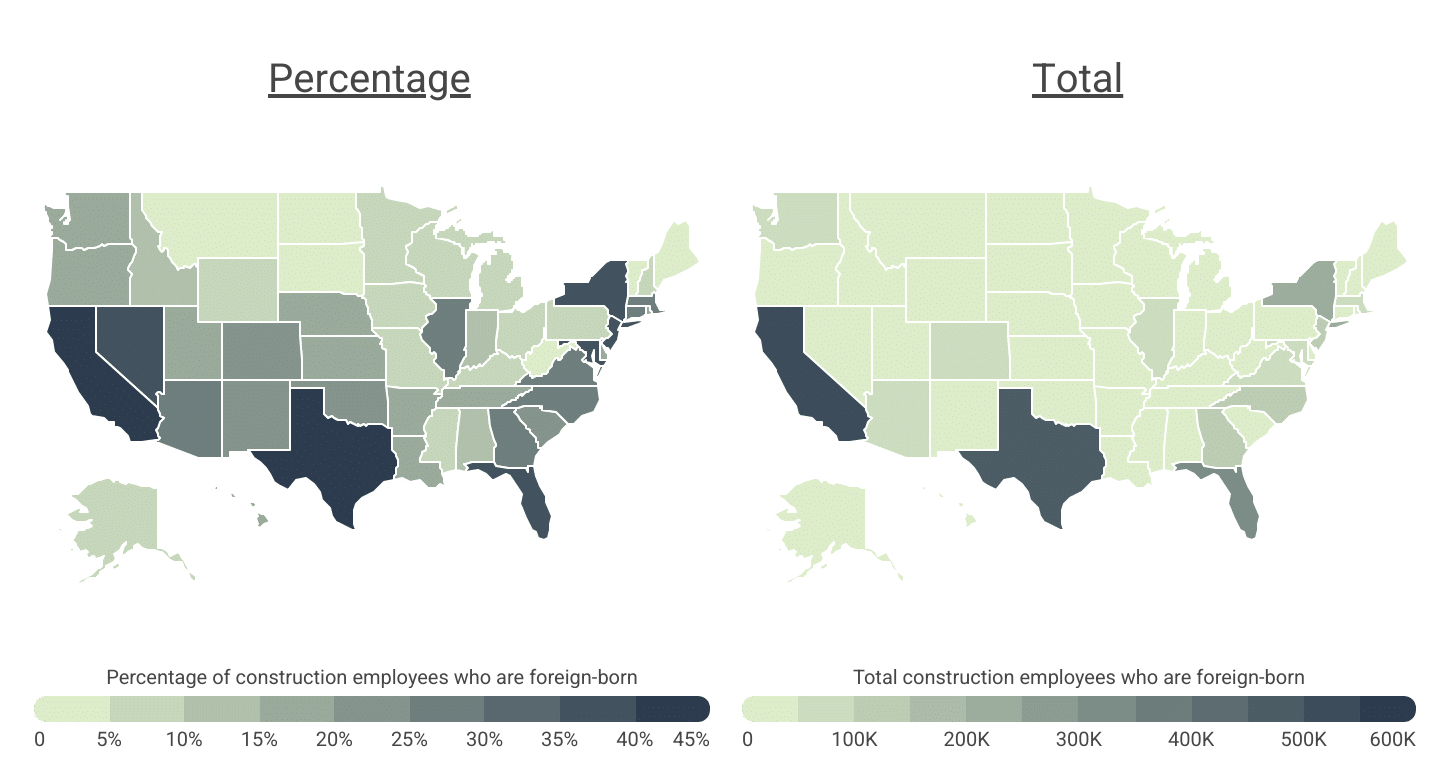
521,000 foreign-born workers account for 41.5% of California’s construction industry employment
Data: Foreign-Born Construction Industry Employment by State
| State | Foreign-born employment share |
|---|---|
| California | 41.5% |
| Texas | 40.2% |
| New Jersey | 38.7% |
| Florida | 37.9% |
| New York | 37.1% |
| Nevada | 36.3% |
| Maryland | 35.1% |
| Georgia | 29.1% |
| Connecticut | 28.0% |
| Virginia | 27.9% |
| North Carolina | 27.4% |
| Arizona | 26.9% |
| Massachusetts | 26.4% |
| Illinois | 25.5% |
| New Mexico | 23.8% |
| Colorado | 21.4% |
| Oklahoma | 20.8% |
| South Carolina | 20.0% |
| Arkansas | 19.7% |
| Utah | 19.7% |
| Tennessee | 18.9% |
| Delaware | 18.8% |
| Hawaii | 18.7% |
| Washington | 18.5% |
| Kansas | 18.4% |
| Rhode Island | 18.3% |
| Nebraska | 17.6% |
| Louisiana | 16.9% |
| Oregon | 15.7% |
| Alabama | 13.3% |
| Indiana | 10.7% |
| Idaho | 10.2% |
| Kentucky | 8.9% |
| Wyoming | 8.7% |
| Pennsylvania | 8.7% |
| Michigan | 8.3% |
| Mississippi | 8.1% |
| Iowa | 8.0% |
| Minnesota | 7.7% |
| New Hampshire | 7.2% |
| Missouri | 6.5% |
| Wisconsin | 6.2% |
| Ohio | 6.1% |
| Alaska | 5.3% |
| South Dakota | 4.9% |
| West Virginia | 3.4% |
| North Dakota | 3.4% |
| Vermont | 3.2% |
| Maine | 3.1% |
| Montana | 2.9% |
| State | Total foreign-born employment |
|---|---|
| California | 521,249 |
| Texas | 491,132 |
| New Jersey | 111,226 |
| Florida | 317,831 |
| New York | 202,790 |
| Nevada | 41,129 |
| Maryland | 81,888 |
| Georgia | 102,493 |
| Connecticut | 31,474 |
| Virginia | 77,050 |
| North Carolina | 102,158 |
| Arizona | 68,723 |
| Massachusetts | 59,377 |
| Illinois | 86,931 |
| New Mexico | 15,704 |
| Colorado | 52,280 |
| Oklahoma | 27,537 |
| South Carolina | 33,939 |
| Arkansas | 19,126 |
| Utah | 25,893 |
| Tennessee | 43,080 |
| Delaware | 6,334 |
| Hawaii | 9,121 |
| Washington | 50,770 |
| Kansas | 16,910 |
| Rhode Island | 6,404 |
| Nebraska | 12,943 |
| Louisiana | 28,339 |
| Oregon | 21,372 |
| Alabama | 20,336 |
| Indiana | 23,014 |
| Idaho | 8,354 |
| Kentucky | 11,626 |
| Wyoming | 2,089 |
| Pennsylvania | 33,007 |
| Michigan | 23,105 |
| Mississippi | 6,972 |
| Iowa | 8,984 |
| Minnesota | 14,475 |
| New Hampshire | 3,915 |
| Missouri | 13,099 |
| Wisconsin | 11,808 |
| Ohio | 20,572 |
| Alaska | 1,223 |
| South Dakota | 1,640 |
| West Virginia | 1,694 |
| North Dakota | 1,032 |
| Vermont | 825 |
| Maine | 1,680 |
| Montana | 1,439 |
While 26% of U.S. construction industry employment is foreign-born, this immigrant dependence is not distributed equally. Foreign-born workers make up a substantial share of the construction workforce along the West Coast, the Southwest, and the Northeast. California leads the nation with 521,249 foreign-born construction industry employees, representing 41.5% of the state’s total construction workforce. Texas follows with 491,132 foreign-born workers (40.2%), while New Jersey (38.7%), Florida (37.9%), and New York (37.1%) round out the top five. Together, these five states account for more than 1.6 million immigrant construction industry employees nationwide.
At the other end of the spectrum, foreign-born workers make up only a small fraction of the construction workforce in many Mountain West and New England states. In Montana, Maine, and Vermont, fewer than 3.5% of construction industry employees are foreign-born. These regional differences reflect long-standing immigration settlement patterns as well as variations in local labor supply and industry demand.
These statewide trends are even more pronounced at the metro level. In several large urban areas, foreign-born workers make up more than half of all construction industry employment. The share is highest in Miami (66.2%), followed by Los Angeles (53.7%), Washington, D.C. (51.7%), and Houston (51.4%). Other major metros with high immigrant concentrations include New York (48.9%), San Francisco (47.0%), and San Jose (47.0%). These patterns reflect the geographic clustering of immigrant populations, the scale of urban construction activity, and the deep integration of foreign-born labor into local building trades.
Accurately plan projects amid workforce shifts
With foreign-born workers’ comprising a growing share of the construction industry, estimating labor costs and project timelines is more complex than ever. Explore our construction estimating software to create precise budgets, account for labor fluctuations, and keep your projects on track in a rapidly evolving workforce landscape.
Below is a complete breakdown of foreign-born construction industry employment across more than 260 metropolitan areas and all 50 states. The analysis was conducted by researchers at Construction Coverage, using data from the U.S. Census Bureau. For more information, refer to the methodology section.
Top & Bottom Cities for Immigrant Construction Labor
| Top Large Metros | Percentage* |
|---|---|
| 1. Miami-Fort Lauderdale-West Palm Beach, FL | 66.2% |
| 2. Los Angeles-Long Beach-Anaheim, CA | 53.7% |
| 3. Washington-Arlington-Alexandria, DC-VA-MD-WV | 51.7% |
| 4. Houston-The Woodlands-Sugar Land, TX | 51.4% |
| 5. New York-Newark-Jersey City, NY-NJ-PA | 48.9% |
| 6. San Francisco-Oakland-Hayward, CA | 47.0% |
| 7. San Jose-Sunnyvale-Santa Clara, CA | 47.0% |
| 8. Dallas-Fort Worth-Arlington, TX | 45.9% |
| 9. Las Vegas-Henderson-Paradise, NV | 41.2% |
| 10. Atlanta-Sandy Springs-Roswell, GA | 38.5% |
| 11. Riverside-San Bernardino-Ontario, CA | 37.4% |
| 12. Orlando-Kissimmee-Sanford, FL | 35.6% |
| 13. Charlotte-Concord-Gastonia, NC-SC | 34.6% |
| 14. San Antonio-New Braunfels, TX | 34.5% |
| 15. Raleigh, NC | 33.2% |
| Bottom Large Metros | Percentage* |
|---|---|
| 1. Pittsburgh, PA | 3.7% |
| 2. St. Louis, MO-IL | 5.7% |
| 3. Buffalo-Cheektowaga-Niagara Falls, NY | 6.1% |
| 4. Cleveland-Elyria, OH | 7.3% |
| 5. Rochester, NY | 7.6% |
| 6. Cincinnati, OH-KY-IN | 8.4% |
| 7. Minneapolis-St. Paul-Bloomington, MN-WI | 9.6% |
| 8. Milwaukee-Waukesha-West Allis, WI | 10.5% |
| 9. Detroit-Warren-Dearborn, MI | 13.0% |
| 10. Columbus, OH | 13.4% |
| 11. Louisville/Jefferson County, KY-IN | 13.9% |
| 12. Kansas City, MO-KS | 15.6% |
| 13. Virginia Beach-Norfolk-Newport News, VA-NC | 15.7% |
| 14. Indianapolis-Carmel-Anderson, IN | 16.5% |
| 15. Jacksonville, FL | 16.6% |
| Top Midsize Metros | Percentage* |
|---|---|
| 1. McAllen-Edinburg-Mission, TX | 56.0% |
| 2. Brownsville-Harlingen, TX | 51.6% |
| 3. Bridgeport-Stamford-Norwalk, CT | 50.5% |
| 4. Naples-Immokalee-Marco Island, FL | 50.3% |
| 5. Trenton, NJ | 49.0% |
| 6. El Paso, TX | 44.2% |
| 7. Stockton-Lodi, CA | 41.3% |
| 8. Santa Maria-Santa Barbara, CA | 41.0% |
| 9. Modesto, CA | 40.8% |
| 10. Salinas, CA | 38.6% |
| 11. Oxnard-Thousand Oaks-Ventura, CA | 37.7% |
| 12. Cape Coral-Fort Myers, FL | 37.4% |
| 13. Vallejo-Fairfield, CA | 36.5% |
| 14. Fayetteville-Springdale-Rogers, AR-MO | 36.0% |
| 15. Bakersfield, CA | 31.2% |
| Bottom Midsize Metros | Percentage* |
|---|---|
| 1. Canton-Massillon, OH | 1.9% |
| 2. Youngstown-Warren-Boardman, OH-PA | 1.9% |
| 3. Toledo, OH | 3.2% |
| 4. Portland-South Portland, ME | 3.9% |
| 5. Anchorage, AK | 4.5% |
| 6. Lansing-East Lansing, MI | 5.2% |
| 7. Lancaster, PA | 5.2% |
| 8. Syracuse, NY | 5.6% |
| 9. Harrisburg-Carlisle, PA | 5.7% |
| 10. Akron, OH | 5.9% |
| 11. York-Hanover, PA | 6.0% |
| 12. Kalamazoo-Portage, MI | 6.1% |
| 13. Springfield, MO | 7.2% |
| 14. Spokane-Spokane Valley, WA | 7.3% |
| 15. Mobile, AL | 7.5% |
| Top Small Metros | Percentage* |
|---|---|
| 1. Laredo, TX | 53.4% |
| 2. Merced, CA | 47.6% |
| 3. El Centro, CA | 41.2% |
| 4. Yuma, AZ | 40.1% |
| 5. Gainesville, GA | 40.0% |
| 6. College Station-Bryan, TX | 37.7% |
| 7. Waco, TX | 36.5% |
| 8. Burlington, NC | 35.1% |
| 9. Madera, CA | 34.2% |
| 10. Napa, CA | 32.3% |
| 11. Odessa, TX | 31.6% |
| 12. Tyler, TX | 31.5% |
| 13. Las Cruces, NM | 30.8% |
| 14. Midland, TX | 29.1% |
| 15. Yuba City, CA | 28.6% |
| Bottom Small Metros | Percentage* |
|---|---|
| 1. Mansfield, OH | 0.0% |
| 2. Charleston, WV | 0.5% |
| 3. St. Joseph, MO-KS | 0.7% |
| 4. Wausau, WI | 0.8% |
| 5. Johnstown, PA | 1.6% |
| 6. Glens Falls, NY | 1.9% |
| 7. Monroe, MI | 2.0% |
| 8. Coeur d’Alene, ID | 2.1% |
| 9. Jackson, MI | 2.3% |
| 10. Lima, OH | 2.5% |
| 11. Lebanon, PA | 2.6% |
| 12. Bismarck, ND | 2.7% |
| 13. Beckley, WV | 2.9% |
| 14. Muskegon, MI | 3.0% |
| 15. Saginaw, MI | 3.1% |
Top & Bottom States for Immigrant Construction Labor
| Top States | Percentage* |
|---|---|
| 1. California | 41.5% |
| 2. Texas | 40.2% |
| 3. New Jersey | 38.7% |
| 4. Florida | 37.9% |
| 5. New York | 37.1% |
| 6. Nevada | 36.3% |
| 7. Maryland | 35.1% |
| 8. Georgia | 29.1% |
| 9. Connecticut | 28.0% |
| 10. Virginia | 27.9% |
| 11. North Carolina | 27.4% |
| 12. Arizona | 26.9% |
| 13. Massachusetts | 26.4% |
| 14. Illinois | 25.5% |
| 15. New Mexico | 23.8% |
| Bottom States | Percentage* |
|---|---|
| 1. Montana | 2.9% |
| 2. Maine | 3.1% |
| 3. Vermont | 3.2% |
| 4. West Virginia | 3.4% |
| 5. North Dakota | 3.4% |
| 6. South Dakota | 4.9% |
| 7. Alaska | 5.3% |
| 8. Ohio | 6.1% |
| 9. Wisconsin | 6.2% |
| 10. Missouri | 6.5% |
| 11. New Hampshire | 7.2% |
| 12. Minnesota | 7.7% |
| 13. Iowa | 8.0% |
| 14. Mississippi | 8.1% |
| 15. Michigan | 8.3% |
*Percentage of construction employees who are foreign-born
Full Results: Foreign Construction Worker Dependency by Location
Methodology
To determine the locations where the construction industry depends most on foreign workers, researchers at Construction Coverage used the latest available data from the U.S. Census Bureau’s 2023 American Community Survey 5-year estimates. Locations were ranked by the percentage of construction employees who are foreign-born, and in the event of a tie, locations with the greater number of construction employees who are foreign-born were ranked higher. The total construction industry employment and the percentage of all workers who are foreign-born were also calculated.
For relevance, only metropolitan areas with complete data were included, and metros were grouped into the following population cohorts: small (less than 350,000), midsize (350,000–1,000,000), and large (more than 1,000,000).
References
- U.S. Census Bureau (2023). American Community Survey. https://www.census.gov/programs-surveys/acs.