
U.S. Cities With the Biggest Change in Rent Prices
Note: This is the most recent release of our U.S. Cities With the Biggest Change in Rent Prices study. To see data from previous years, please visit the Full Results section below.
While, in many ways, the U.S. economy looks strong—with low unemployment levels, easing inflation, and a robust stock market—many Americans continue to feel the squeeze of high costs. The inflation rate has come down from its peak in mid-2022, but the effects of several years of record price increases still linger, leaving households struggling to make ends meet.
One of the most pressing financial challenges for many is the cost of housing. According to data from Zillow, median rents are approximately 35% higher today than they were before the pandemic. With high home prices and mortgage interest rates pricing many would-be buyers out of the real estate market, rentals have been highly competitive.
Underlying these trends is a long-term shortage of housing stock in the United States. Many builders were hard-hit by the Great Recession, and as a result, the U.S. dramatically underbuilt its housing stock throughout the 2010s. Renters are feeling the consequences: rental vacancy rates are near their lowest level on record. In short, this means that more renters are competing for fewer available units.
Change in Rents Over Time
Rent price growth has returned to pre-pandemic norms
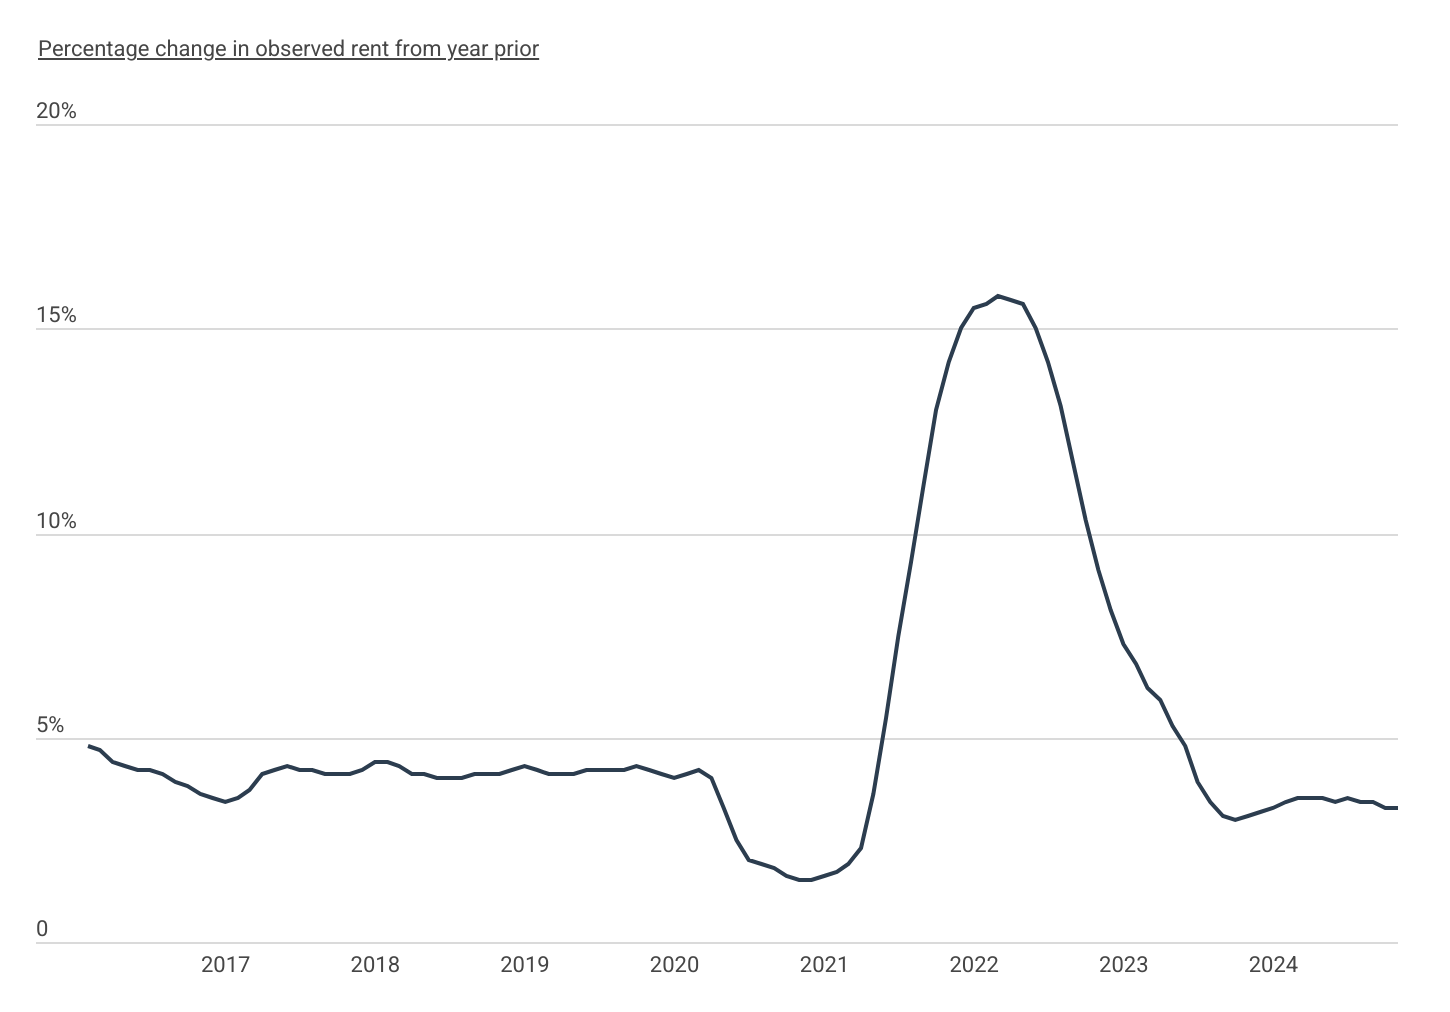
The long-term supply challenges around housing stock came to a head during the COVID-19 pandemic. Government stimulus and renter protection programs helped keep rents low during the early months of the pandemic, but rent growth began to spike in early 2021. According to data from the Zillow Observed Rent Index, year-over-year rent growth exploded from just under 2% in February 2021 to nearly 16% in February 2022 before falling back down.
By mid-2023, rent growth had slowed to pre-pandemic rates, averaging 3.4% annually over the past year. However, this slower pace doesn’t mean rents have fallen—only that they are rising more gradually. The cumulative effect of rapid price growth continues to strain renters nationwide.
Rent Increase by Rental Size
Median rents will increase slightly more for smaller rental units
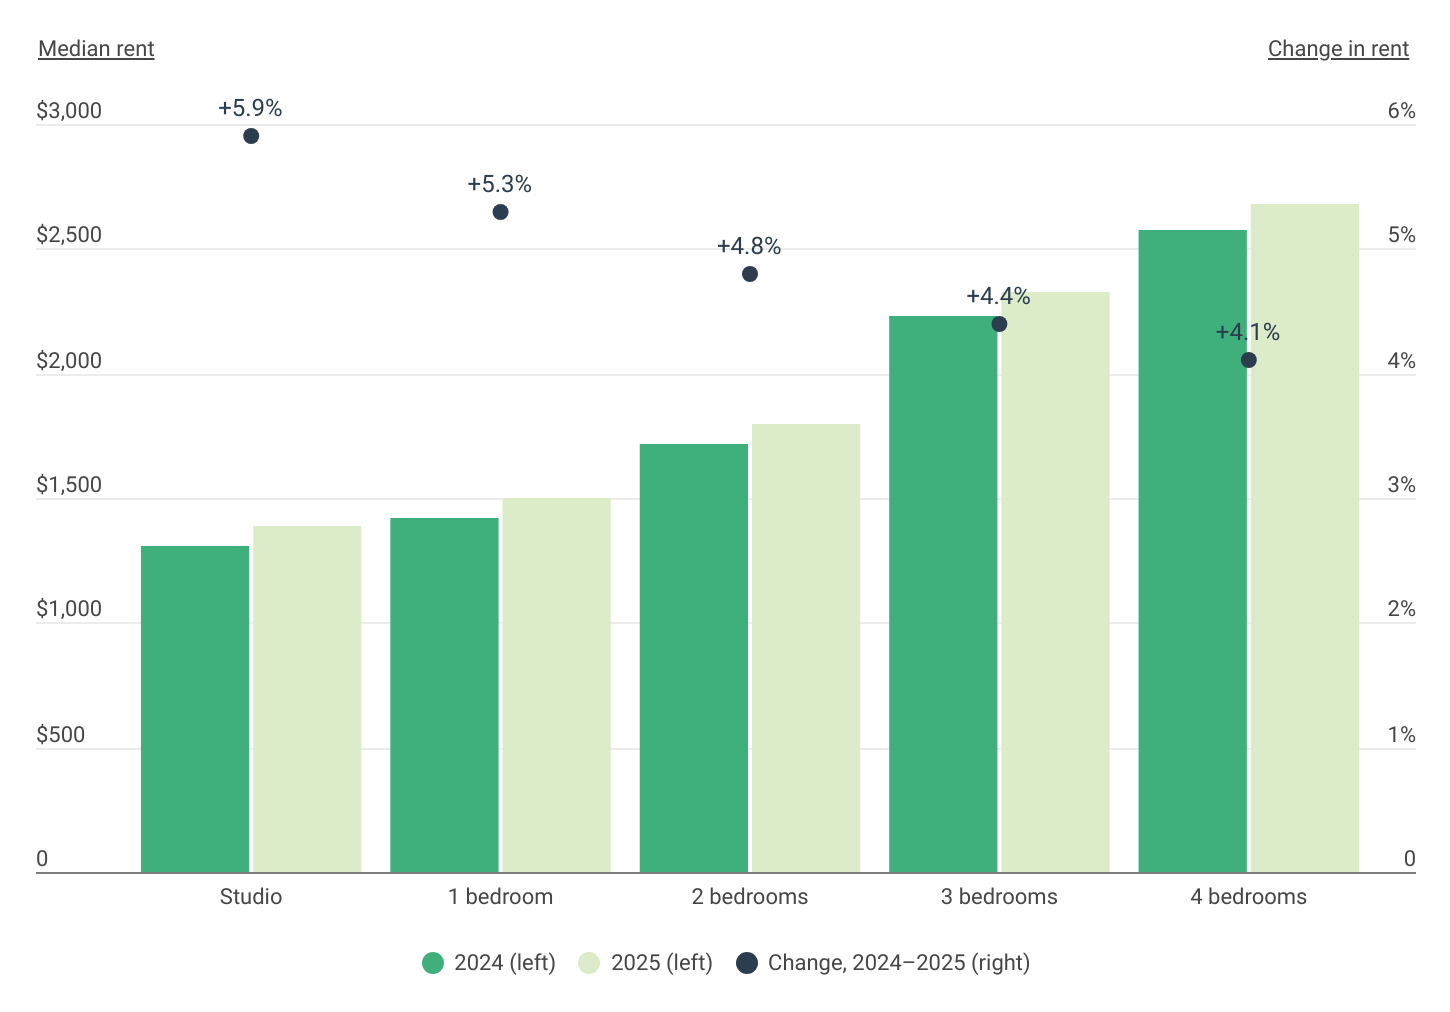
No part of the rental market has been able to avoid continued price increases, with smaller units experiencing slightly higher growth rates. According to the latest estimates from the U.S. Department of Housing and Urban Development (HUD), median rents for 2025 are expected to be 4.8% higher nationally than in 2024, reflecting continued pressure on housing costs.
Studio apartments are projected to see the largest increase, with rents rising 5.9% to a median of $1,384 in 2025. One-bedroom units follow closely with a 5.3% increase, while two-bedroom units are expected to rise by 4.8%. Larger rentals will see smaller, but still significant, increases: median rents for three-bedroom homes are projected to grow 4.4%, while four-bedroom homes will rise by 4.1% to $2,681.
States Where Rent Is Rising Fastest
Rent increases in Montana & Idaho are more than 4X the national average
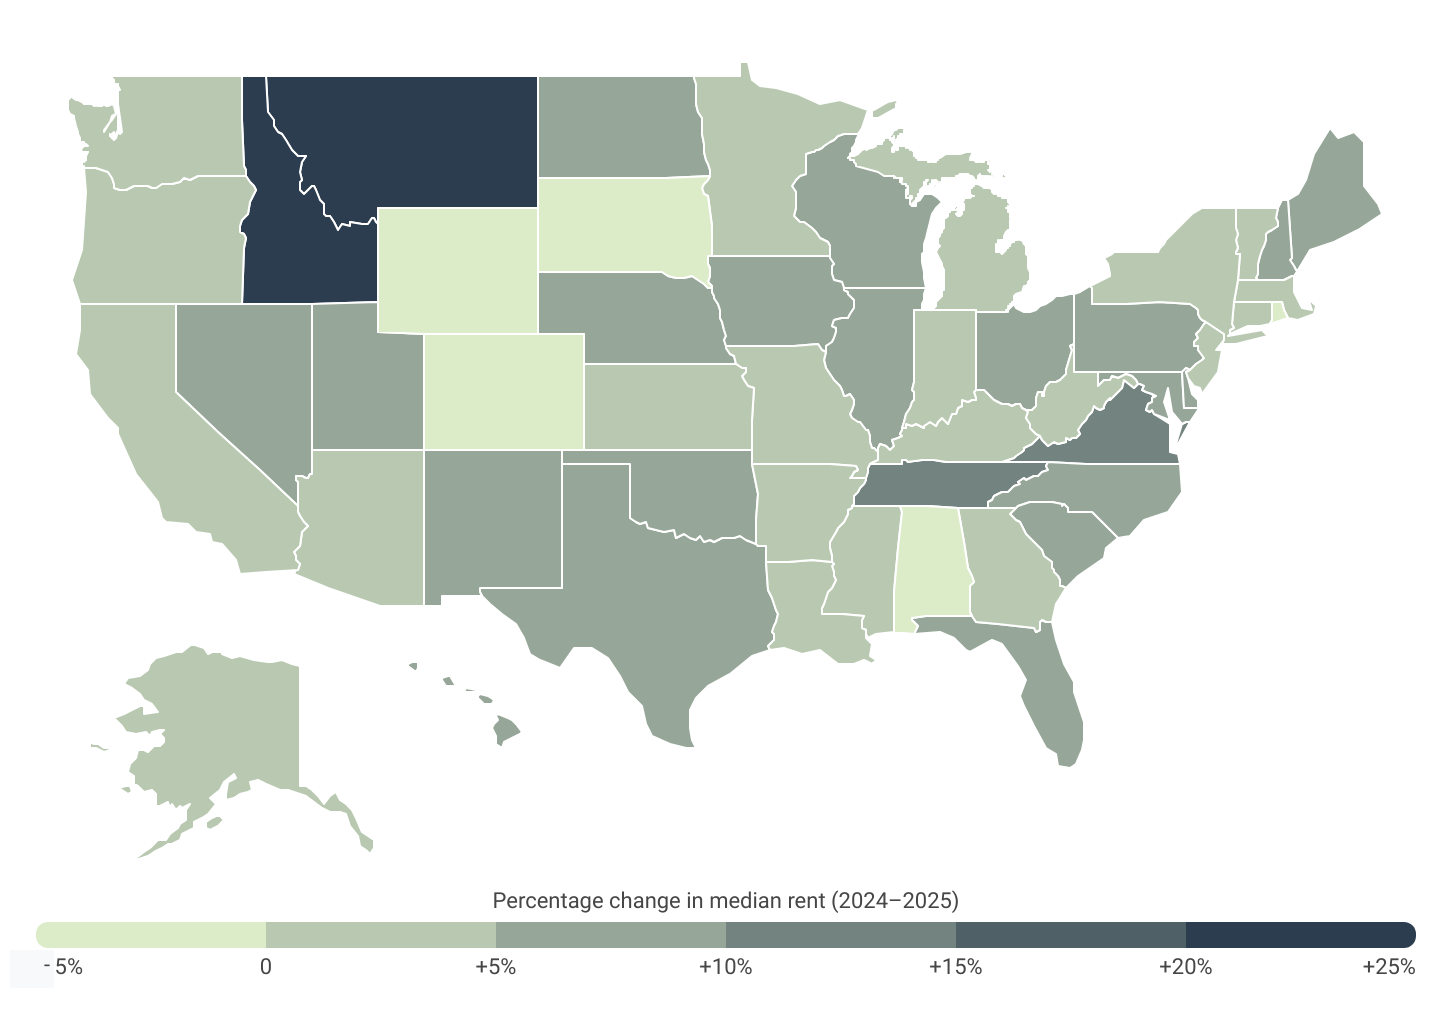
Rent projections for 2025 show significant growth in the Mountain West, with Montana and Idaho leading the nation. Rents in Montana are projected to be 20.7% higher than in 2024, while Idaho is expected to see a 20.3% increase—both more than four times the national average of 4.8%. Virginia (11.6%), Tennessee (10.7%), and Hawaii (9.2%) also rank among the states with the steepest increases, reflecting ongoing housing demand and limited supply.
At the metropolitan level, changes in rent are even more pronounced. Median rents in Bozeman, MT are forecasted to be 37.4% higher in 2025 than the year before. Boise City, ID follows with a 32.1% increase, while Helena, MT is projected to see rents climb by 29.5%. These cities highlight the housing affordability challenges in the Mountain West as population growth and limited inventory continue to create highly competitive markets.
However, in some areas, rents are actually on the decline. At the state level, Rhode Island (-4.8%), Wyoming (-4.1%), and South Dakota (-4.0%) are reporting the largest decreases in rent for 2025. At the metro level, Santa Maria-Santa Barbara, CA is projected to experience the sharpest drop of any market in the country, at -15.1%, after experiencing a major surge in rent and housing prices during the COVID-19 pandemic.
Below is a complete breakdown of changes in rent prices across more than 350 metropolitan areas and all 50 states. The analysis was conducted by researchers at Construction Coverage, using data from the Department of Housing and Urban Development’s (HUD) and the U.S. Census Bureau. For more information, refer to the methodology section.
Cities With the Biggest Change in Rent Prices
| Top Large Metros | Change* |
|---|---|
| 1. Charlotte-Concord-Gastonia, NC-SC | +16.8% |
| 2. Riverside-San Bernardino-Ontario, CA | +14.7% |
| 3. Virginia Beach-Chesapeake-Norfolk, VA-NC | +14.4% |
| 4. Washington-Arlington-Alexandria, DC-VA-MD-WV | +13.8% |
| 5. Houston-Pasadena-The Woodlands, TX | +13.3% |
| 6. Nashville-Davidson–Murfreesboro–Franklin, TN | +12.5% |
| 7. Richmond, VA | +12.5% |
| 8. Columbus, OH | +11.1% |
| 9. Pittsburgh, PA | +11.0% |
| 10. San Jose-Sunnyvale-Santa Clara, CA | +10.1% |
| 11. Milwaukee-Waukesha, WI | +9.9% |
| 12. Cincinnati, OH-KY-IN | +8.8% |
| 13. Cleveland, OH | +8.7% |
| 14. Salt Lake City-Murray, UT | +8.5% |
| 15. Rochester, NY | +8.5% |
| Bottom Large Metros | Change* |
|---|---|
| 1. Indianapolis-Carmel-Greenwood, IN | -4.0% |
| 2. Providence-Warwick, RI-MA | -3.8% |
| 3. Denver-Aurora-Centennial, CO | -3.2% |
| 4. Hartford-East Hartford-Middletown, CT | -1.1% |
| 5. Boston-Cambridge-Newton, MA-NH | -0.3% |
| 6. Atlanta-Sandy Springs-Roswell, GA | +0.7% |
| 7. Buffalo-Cheektowaga, NY | +1.1% |
| 8. San Francisco-Oakland-Fremont, CA | +1.1% |
| 9. Baltimore-Columbia-Towson, MD | +1.3% |
| 10. Portland-Vancouver-Hillsboro, OR-WA | +1.3% |
| 11. Seattle-Tacoma-Bellevue, WA | +1.4% |
| 12. New York-Newark-Jersey City, NY-NJ | +1.5% |
| 13. St. Louis, MO-IL | +1.7% |
| 14. San Diego-Chula Vista-Carlsbad, CA | +1.7% |
| 15. Birmingham, AL | +1.8% |
| Top Midsize Metros | Change* |
|---|---|
| 1. Boise City, ID | +32.1% |
| 2. Knoxville, TN | +25.0% |
| 3. Pensacola-Ferry Pass-Brent, FL | +24.6% |
| 4. Deltona-Daytona Beach-Ormond Beach, FL | +21.7% |
| 5. Syracuse, NY | +18.0% |
| 6. Durham-Chapel Hill, NC | +14.8% |
| 7. Salem, OR | +14.5% |
| 8. Chattanooga, TN-GA | +14.4% |
| 9. Charleston-North Charleston, SC | +14.3% |
| 10. York-Hanover, PA | +14.3% |
| 11. Palm Bay-Melbourne-Titusville, FL | +14.2% |
| 12. Des Moines-West Des Moines, IA | +13.3% |
| 13. Gainesville, FL | +12.6% |
| 14. Ogden, UT | +12.3% |
| 15. Urban Honolulu, HI | +12.2% |
| Bottom Midsize Metros | Change* |
|---|---|
| 1. Santa Maria-Santa Barbara, CA | -15.1% |
| 2. Asheville, NC | -9.8% |
| 3. Flint, MI | -6.2% |
| 4. Little Rock-North Little Rock-Conway, AR | -5.1% |
| 5. Santa Rosa-Petaluma, CA | -4.7% |
| 6. Shreveport-Bossier City, LA | -4.0% |
| 7. Fayetteville, NC | -3.8% |
| 8. Baton Rouge, LA | -3.5% |
| 9. Tallahassee, FL | -2.0% |
| 10. Fayetteville-Springdale-Rogers, AR | -2.0% |
| 11. Wichita, KS | -1.9% |
| 12. Montgomery, AL | -1.7% |
| 13. Gulfport-Biloxi, MS | -1.5% |
| 14. Beaumont-Port Arthur, TX | -0.9% |
| 15. Lexington-Fayette, KY | -0.8% |
| Top Small Metros | Change* |
|---|---|
| 1. Bozeman, MT | +37.4% |
| 2. Helena, MT | +29.5% |
| 3. Idaho Falls, ID | +18.8% |
| 4. Twin Falls, ID | +18.7% |
| 5. Pinehurst-Southern Pines, NC | +18.4% |
| 6. Midland, TX | +17.7% |
| 7. Utica-Rome, NY | +17.0% |
| 8. Coeur d’Alene, ID | +16.8% |
| 9. Pocatello, ID | +16.6% |
| 10. Kingsport-Bristol, TN-VA | +16.6% |
| 11. Harrisonburg, VA | +15.7% |
| 12. Prescott Valley-Prescott, AZ | +14.9% |
| 13. Rochester, MN | +14.9% |
| 14. Bangor, ME | +14.9% |
| 15. Grand Island, NE | +14.4% |
| Bottom Small Metros | Change* |
|---|---|
| 1. Jacksonville, NC | -10.5% |
| 2. Boulder, CO | -7.0% |
| 3. Watertown-Fort Drum, NY | -6.2% |
| 4. Bloomington, IL | -5.5% |
| 5. San Luis Obispo-Paso Robles, CA | -5.1% |
| 6. Greenville, NC | -5.1% |
| 7. Rapid City, SD | -4.0% |
| 8. Daphne-Fairhope-Foley, AL | -3.4% |
| 9. Evansville, IN | -3.4% |
| 10. Eagle Pass, TX | -3.4% |
| 11. Elkhart-Goshen, IN | -3.2% |
| 12. Morgantown, WV | -3.2% |
| 13. Grants Pass, OR | -2.1% |
| 14. Clarksville, TN-KY | -1.9% |
| 15. Blacksburg-Christiansburg-Radford, VA | -1.7% |
States With the Biggest Change in Rent Prices
| Top States | Change* |
|---|---|
| 1. Montana | +20.7% |
| 2. Idaho | +20.3% |
| 3. Virginia | +11.6% |
| 4. Tennessee | +10.7% |
| 5. Hawaii | +9.2% |
| 6. Utah | +8.3% |
| 7. Maine | +8.1% |
| 8. Ohio | +7.9% |
| 9. North Carolina | +7.7% |
| 10. South Carolina | +7.7% |
| 11. New Hampshire | +7.5% |
| 12. Wisconsin | +7.5% |
| 13. Maryland | +7.1% |
| 14. Nevada | +6.6% |
| 15. Florida | +6.4% |
| Bottom States | Change* |
|---|---|
| 1. Rhode Island | -4.8% |
| 2. Wyoming | -4.1% |
| 3. South Dakota | -4.0% |
| 4. Colorado | -2.0% |
| 5. Alabama | -1.3% |
| 6. Arkansas | +0.3% |
| 7. Indiana | +1.1% |
| 8. New York | +1.5% |
| 9. Massachusetts | +1.5% |
| 10. West Virginia | +1.9% |
| 11. Washington | +1.9% |
| 12. Connecticut | +2.1% |
| 13. Vermont | +2.2% |
| 14. Kansas | +2.4% |
| 15. Georgia | +2.5% |
*Percentage change in median rent (2024–2025)
Full Results
Methodology
The data used in this analysis is from the U.S. Department of Housing and Urban Development’s (HUD) 50th Percentile Rent Estimates and the U.S. Census Bureau’s 2023 American Community Survey. To determine the locations with the biggest change in rent prices, researchers at Construction Coverage ranked locations by the percentage change in median rent from 2024 to 2025. In the event of a tie, locations with the greater total change in median rent from 2024 to 2025 was ranked higher. For each location, the median rent was estimated by creating a weighted average of HUD’s median rent estimates by unit size using the number of renter-occupied households by unit size as the weighting factor.
Rent estimates for 2024 published in this report differ slightly from those published last year due to a combination of data revisions from HUD alongside housing unit updates from Census. To improve relevance only metropolitan areas with complete data were included. Due to limitations in the HUD dataset, rent estimates for Connecticut metros were calculated using county boundaries rather than newer planning region boundaries. Additionally, metros were grouped into cohorts based on population: small (under 350,000), midsize (350,000–999,999), and large (1,000,000 or more).
References
- U.S. Bureau of Labor Statistics (2024). Graphics for Economic News Releases, 12-Month Percentage Change, Consumer Price Index, Selected Categories. https://www.bls.gov/charts/consumer-price-index/consumer-price-index-by-category-line-chart.htm.
- U.S. Census Bureau and U.S. Department of Housing and Urban Development (October 24, 2024). Median Sales Price of Houses Sold for the United States. https://fred.stlouisfed.org/series/MSPUS.
- Freddie Mac (November 21, 2024). 30-Year Fixed Rate Mortgage Average in the United States. https://fred.stlouisfed.org/series/MORTGAGE30US.
- Weinstock, L.R. (July 10, 2023). The U.S. Housing Underbuilding Gap. Congressional Research Service. https://crsreports.congress.gov/product/pdf/IN/IN12195.
- U.S. Census Bureau (October 29, 2024). Rental Vacancy Rate for the United States. https://fred.stlouisfed.org/series/RRVRUSQ156N.
- Office of Policy Development and Research (January 2024). 50th Percentile Rent Estimates. https://www.huduser.gov/portal/datasets/50per.html.
- U.S. Census Bureau (2023). American Community Survey (ACS). https://www.census.gov/programs-surveys/acs.