U.S. Cities Building the Most Multi-Family Housing
Note: This is the most recent release of our U.S. Cities Building the Most Multi-Family Housing study. To see data from previous years, please visit the Full Results section below.
The U.S. housing market remains a critical economic issue, with housing affordability and supply at the forefront of bipartisan policy agendas. Both Republican and Democratic lawmakers are increasingly focused on expanding access to affordable housing and addressing the nationwide housing shortage. According to a recent Freddie Mac analysis, the U.S. faces a shortfall of 3.7 million housing units, a deficit that continues to drive high prices for both homeowners and renters.
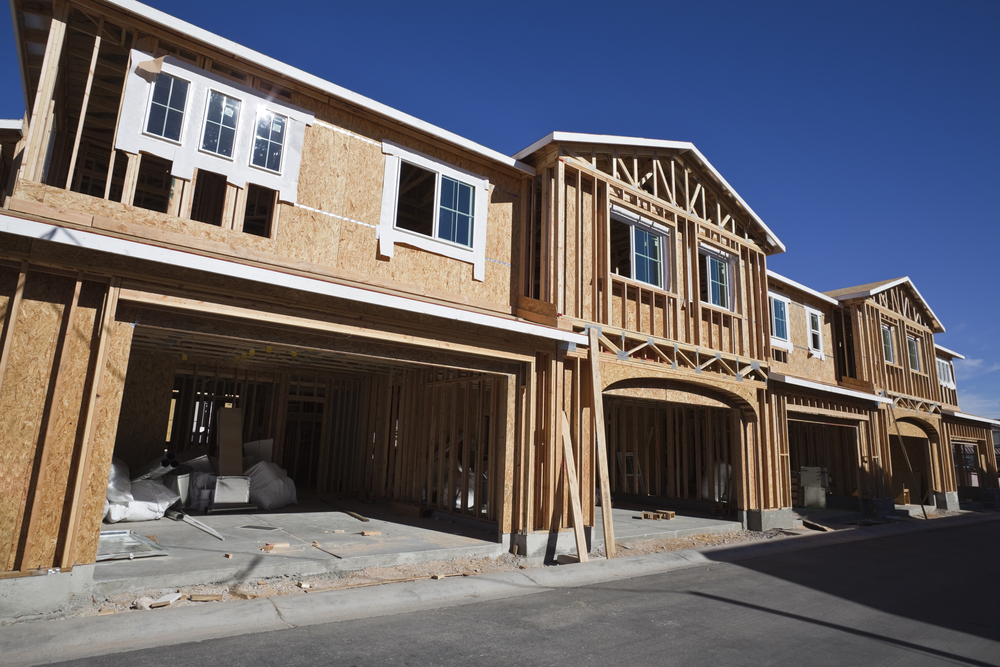
Expanding multi-family housing—such as townhomes, condos, and apartments—offers one of the most effective solutions for addressing this shortage and improving affordability. Multi-family developments allow for higher housing density in urban and suburban areas and are generally more cost-efficient to build than single-family homes, making them a faster and cheaper way to increase supply. However, restrictive zoning regulations in many areas have historically made it difficult or even impossible to construct multi-family housing.
Recently, though, there has been growing political momentum to relax or eliminate these zoning restrictions, among other barriers to new home construction. And as such, more higher-density housing may be on the horizon.
Is the U.S. Building More Multi-Family Housing Than in the Past?
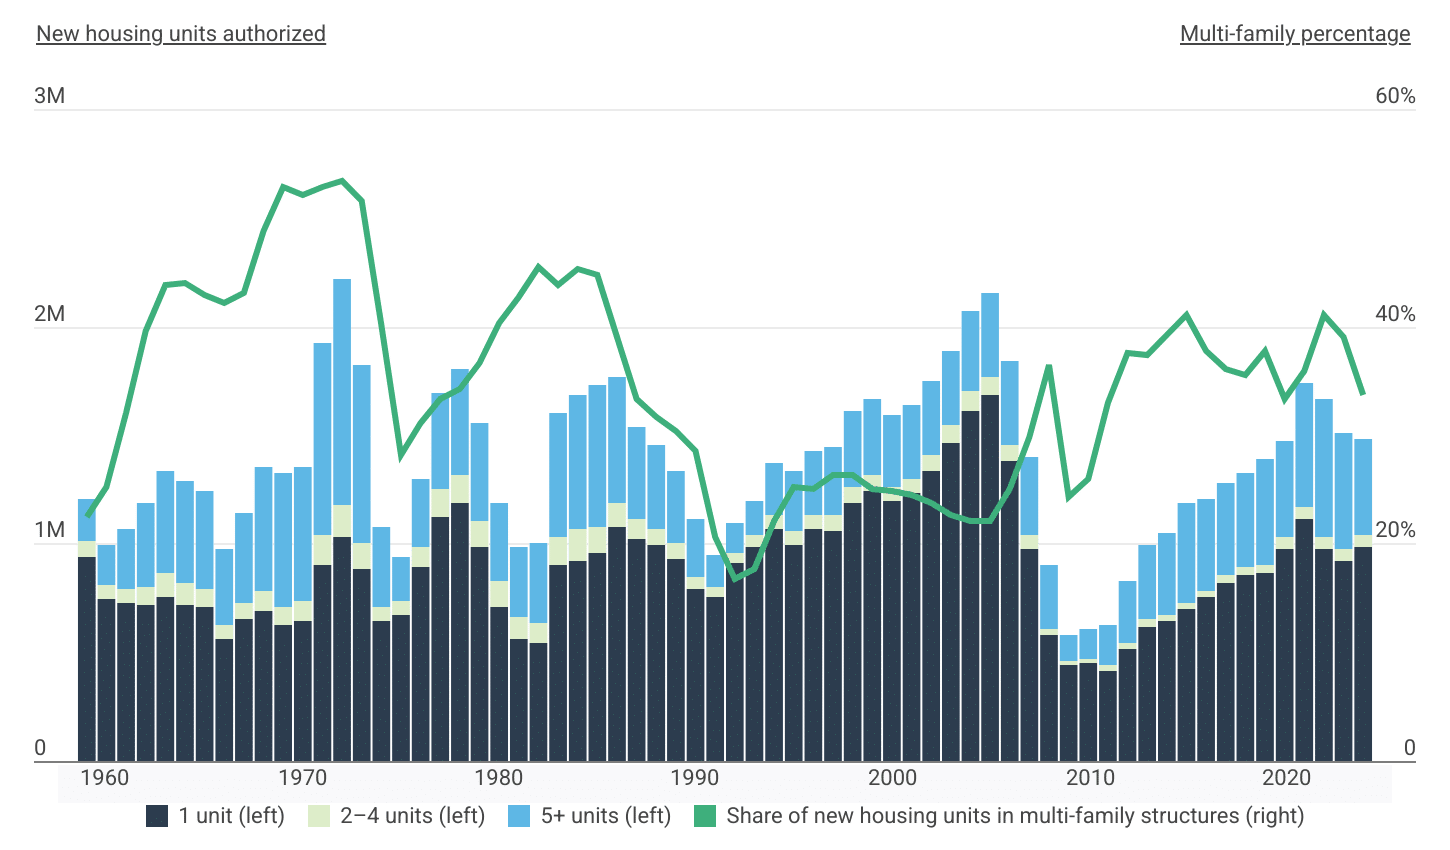
Multi-family housing permitting has plateaued after reaching its highest level since 1986
Data: Multi-family housing compared to single-family housing over time
| Year | 1 unit | 2–4 units | 5+ units | Multi-family share |
|---|---|---|---|---|
| 1959 | 938,000 | 77,000 | 193,000 | 22.4% |
| 1960 | 745,900 | 64,500 | 187,100 | 25.2% |
| 1961 | 722,800 | 67,600 | 273,800 | 32.1% |
| 1962 | 716,200 | 87,100 | 383,300 | 39.6% |
| 1963 | 750,200 | 118,900 | 465,600 | 43.8% |
| 1964 | 720,100 | 100,800 | 464,900 | 44.0% |
| 1965 | 709,900 | 84,700 | 445,900 | 42.8% |
| 1966 | 563,200 | 61,000 | 347,700 | 42.1% |
| 1967 | 650,600 | 73,000 | 417,500 | 43.0% |
| 1968 | 694,700 | 84,300 | 574,400 | 48.7% |
| 1969 | 624,800 | 85,200 | 612,400 | 52.8% |
| 1970 | 646,800 | 88,100 | 616,700 | 52.1% |
| 1971 | 906,100 | 132,900 | 885,700 | 52.9% |
| 1972 | 1,033,100 | 148,600 | 1,037,200 | 53.4% |
| 1973 | 882,100 | 117,000 | 820,500 | 51.5% |
| 1974 | 643,800 | 64,400 | 366,200 | 40.1% |
| 1975 | 675,500 | 63,800 | 199,800 | 28.1% |
| 1976 | 893,600 | 93,100 | 309,500 | 31.1% |
| 1977 | 1,126,100 | 121,300 | 442,700 | 33.4% |
| 1978 | 1,182,600 | 130,600 | 487,300 | 34.3% |
| 1979 | 981,500 | 125,400 | 444,800 | 36.7% |
| 1980 | 710,400 | 114,500 | 365,700 | 40.3% |
| 1981 | 564,300 | 101,800 | 319,400 | 42.7% |
| 1982 | 546,400 | 88,300 | 365,800 | 45.4% |
| 1983 | 901,500 | 133,700 | 570,100 | 43.8% |
| 1984 | 922,400 | 142,600 | 616,800 | 45.2% |
| 1985 | 956,600 | 120,100 | 656,600 | 44.8% |
| 1986 | 1,077,600 | 108,400 | 583,500 | 39.1% |
| 1987 | 1,024,400 | 89,300 | 421,100 | 33.3% |
| 1988 | 993,800 | 75,700 | 386,100 | 31.7% |
| 1989 | 931,700 | 66,900 | 339,800 | 30.4% |
| 1990 | 793,900 | 54,300 | 262,600 | 28.5% |
| 1991 | 753,500 | 43,100 | 152,100 | 20.6% |
| 1992 | 910,700 | 45,800 | 138,400 | 16.8% |
| 1993 | 986,500 | 52,400 | 160,200 | 17.7% |
| 1994 | 1,068,500 | 62,200 | 241,000 | 22.1% |
| 1995 | 997,300 | 63,800 | 271,500 | 25.2% |
| 1996 | 1,069,500 | 65,800 | 290,300 | 25.0% |
| 1997 | 1,062,400 | 68,400 | 310,300 | 26.3% |
| 1998 | 1,187,600 | 69,200 | 355,500 | 26.3% |
| 1999 | 1,246,700 | 65,800 | 351,100 | 25.1% |
| 2000 | 1,198,100 | 64,900 | 329,300 | 24.8% |
| 2001 | 1,235,600 | 66,000 | 335,200 | 24.5% |
| 2002 | 1,332,600 | 73,700 | 341,400 | 23.8% |
| 2003 | 1,460,900 | 82,500 | 345,800 | 22.7% |
| 2004 | 1,613,400 | 90,400 | 366,200 | 22.1% |
| 2005 | 1,682,000 | 84,000 | 389,300 | 22.0% |
| 2006 | 1,378,200 | 76,600 | 384,100 | 25.1% |
| 2007 | 979,900 | 59,600 | 359,000 | 29.9% |
| 2008 | 575,600 | 34,400 | 295,400 | 36.4% |
| 2009 | 441,100 | 20,700 | 121,100 | 24.3% |
| 2010 | 447,300 | 22,000 | 135,300 | 26.0% |
| 2011 | 418,500 | 21,600 | 184,000 | 32.9% |
| 2012 | 518,700 | 25,900 | 285,100 | 37.5% |
| 2013 | 620,800 | 29,000 | 341,100 | 37.4% |
| 2014 | 640,300 | 29,900 | 382,000 | 39.2% |
| 2015 | 696,000 | 32,100 | 454,500 | 41.1% |
| 2016 | 750,800 | 34,800 | 421,100 | 37.8% |
| 2017 | 820,000 | 37,200 | 424,800 | 36.0% |
| 2018 | 855,300 | 39,700 | 433,800 | 35.6% |
| 2019 | 862,100 | 42,600 | 481,400 | 37.8% |
| 2020 | 979,400 | 47,200 | 444,500 | 33.4% |
| 2021 | 1,115,400 | 52,900 | 568,800 | 35.8% |
| 2022 | 975,600 | 54,800 | 634,700 | 41.0% |
| 2023 | 920,000 | 54,700 | 536,400 | 39.1% |
| 2024 | 981,900 | 54,500 | 441,600 | 33.6% |
During the lead-up to the 2000s housing bubble, loose lending standards and easy access to mortgages fueled demand for larger, single-family homes. Between the mid-1990s and mid-2000s, only about a quarter of new homes built in the U.S. were multi-family units, as Americans largely favored the suburbs. However, after the 2008 market collapse, housing construction slowed dramatically, just as millennials were reaching adulthood and showing a growing preference for urban living. This shift contributed to an urban revival, where demand for higher-density housing began to rise.
In the years following the housing crash, limited construction activity increasingly shifted toward multi-family developments. Between 2009 and 2015, the share of new housing authorizations for multi-family units rose from 24.3% to 41.1%. However, this share has since plateaued, standing at 33.6% as of 2024.
Despite this leveling-off, over 496,000 multi-family housing permits were issued in 2024—more than triple the low of 141,800 during the 2009 market collapse. Still, this figure stands in stark contrast to the nearly 1.2 million multi-family units authorized in 1972, the highest number recorded since the U.S. Census Bureau began tracking the data.
Large-scale housing projects demand tight financial control
Multi-family developments involve layered budgets, multiple subcontractors, and complex draws. Construction accounting software helps track expenses by unit or phase, manage progress payments, and maintain profitability as projects scale.
Regional Differences in Multi-Family Housing
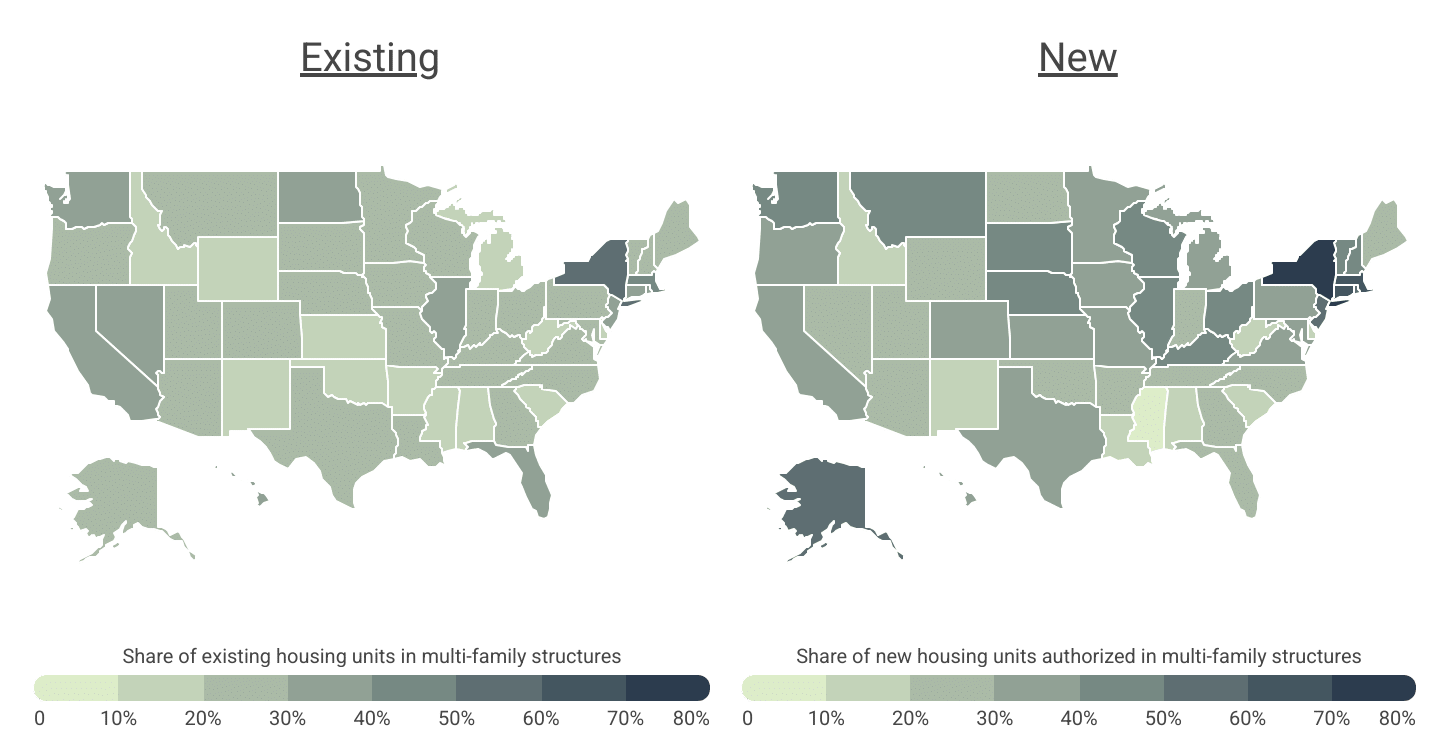
All but 11 states are investing more in multi-family housing now than in the past
Data: Differences in Multi-Family Housing by State
| State | Existing multi-family share |
|---|---|
| New York | 52.8% |
| Massachusetts | 42.8% |
| Rhode Island | 39.7% |
| Hawaii | 38.3% |
| New Jersey | 37.5% |
| Connecticut | 34.5% |
| Illinois | 34.0% |
| North Dakota | 33.5% |
| California | 33.4% |
| Florida | 32.7% |
| Washington | 30.9% |
| Nevada | 30.5% |
| Colorado | 28.7% |
| Texas | 28.3% |
| New Hampshire | 28.1% |
| Wisconsin | 27.5% |
| Oregon | 27.1% |
| Maryland | 26.4% |
| Alaska | 25.6% |
| Minnesota | 25.3% |
| Virginia | 24.4% |
| Utah | 24.2% |
| South Dakota | 24.0% |
| Vermont | 23.5% |
| Ohio | 23.4% |
| Georgia | 23.3% |
| Arizona | 23.2% |
| Nebraska | 22.6% |
| Pennsylvania | 22.3% |
| Maine | 22.2% |
| Tennessee | 22.0% |
| Missouri | 21.5% |
| North Carolina | 21.5% |
| Kentucky | 21.4% |
| Louisiana | 21.4% |
| Iowa | 21.0% |
| Montana | 20.3% |
| Indiana | 20.1% |
| South Carolina | 19.9% |
| Kansas | 19.6% |
| Arkansas | 19.4% |
| Michigan | 19.3% |
| Delaware | 19.3% |
| New Mexico | 18.9% |
| Wyoming | 18.6% |
| Alabama | 18.4% |
| Oklahoma | 18.0% |
| Mississippi | 17.1% |
| Idaho | 17.0% |
| West Virginia | 14.6% |
| State | New multi-family share |
|---|---|
| New York | 77.5% |
| Massachusetts | 60.8% |
| Rhode Island | 53.0% |
| Hawaii | 37.0% |
| New Jersey | 57.6% |
| Connecticut | 64.1% |
| Illinois | 49.2% |
| North Dakota | 28.8% |
| California | 39.8% |
| Florida | 28.8% |
| Washington | 49.3% |
| Nevada | 22.6% |
| Colorado | 36.5% |
| Texas | 30.0% |
| New Hampshire | 41.5% |
| Wisconsin | 45.9% |
| Oregon | 32.9% |
| Maryland | 35.3% |
| Alaska | 56.8% |
| Minnesota | 35.8% |
| Virginia | 33.1% |
| Utah | 26.1% |
| South Dakota | 45.9% |
| Vermont | 47.1% |
| Ohio | 43.4% |
| Georgia | 29.4% |
| Arizona | 29.6% |
| Nebraska | 46.0% |
| Pennsylvania | 34.1% |
| Maine | 22.9% |
| Tennessee | 27.2% |
| Missouri | 37.6% |
| North Carolina | 26.4% |
| Kentucky | 45.2% |
| Louisiana | 15.3% |
| Iowa | 38.0% |
| Montana | 43.4% |
| Indiana | 24.6% |
| South Carolina | 13.8% |
| Kansas | 38.6% |
| Arkansas | 28.2% |
| Michigan | 30.8% |
| Delaware | 12.7% |
| New Mexico | 14.3% |
| Wyoming | 23.6% |
| Alabama | 15.9% |
| Oklahoma | 20.1% |
| Mississippi | 4.6% |
| Idaho | 15.9% |
| West Virginia | 16.1% |
Nationally, about 29% of the existing housing stock consists of multi-family units, though this varies significantly across regions. New York leads the nation with 52.8% of its existing housing classified as multi-family, followed by Massachusetts (42.8%), Rhode Island (39.7%), Hawaii (38.3%), and New Jersey (37.5%). In contrast, states in the South and Mountain West—with more space and larger rural populations—historically invested less in medium- and high-density housing. States like West Virginia, Idaho, Mississippi, and Oklahoma have 18% or less of their housing stock composed of multi-family units.
When considering newly built housing units, a few notable trends stand out. States with traditionally high levels of multi-family housing, such as New York, Connecticut, and Massachusetts, continue to prioritize this type of development. In these states, multi-family units accounted for over 60% of all new authorizations in 2024, with New York leading at 77.5%. In fact, in all but 11 states, the percentage of new housing units categorized as multi-family exceeded that of the existing housing stock last year.
Notably, there has been a surge in multi-family home construction in regions with historically lower concentrations of such housing. In Alaska, for example, where just 25.6% of the existing housing stock is multi-family, a remarkable 56.8% of new units permitted in 2024 were for multi-family developments. Similarly, in the continental West, Washington (49.3%) and Montana (43.4%) were the only states where multi-family units constituted more than 40% of new housing authorizations.
Similar patterns emerge at the local level, where a blend of densely populated coastal cities and focal points in the Midwest and Western United States show the highest rates of multi-family development. There are a few exceptions, but generally, cities in the South report the lowest rates of new multi-family housing. This is likely attributed to lower demand and lower home prices compared to other regions of the country.
More units mean more exposure on every jobsite
With shared walls, common systems, and overlapping crews, multi-family construction compounds the risks of injury and property damage. General liability insurance helps protect builders, developers, and subs from claims that can derail large-scale projects.
Below is a complete breakdown of new multi-family housing development across 387 U.S. metropolitan areas and all 50 states. The analysis was conducted by researchers at Construction Coverage, using data from the U.S. Census Bureau. Refer to the detailed methodology section for more information.
Top & Bottom Cities for Multi-Family Housing Construction
| Top Large Metros | Percent* |
|---|---|
| 1. New York-Newark-Jersey City, NY-NJ | 78.4% |
| 2. San Diego-Chula Vista-Carlsbad, CA | 70.8% |
| 3. Boston-Cambridge-Newton, MA-NH | 66.8% |
| 4. Hartford-West Hartford-East Hartford, CT | 66.0% |
| 5. Miami-Fort Lauderdale-West Palm Beach, FL | 64.4% |
| 6. Seattle-Tacoma-Bellevue, WA | 63.8% |
| 7. Milwaukee-Waukesha, WI | 57.8% |
| 8. Columbus, OH | 56.4% |
| 9. Los Angeles-Long Beach-Anaheim, CA | 56.0% |
| 10. San Francisco-Oakland-Fremont, CA | 53.1% |
| 11. Omaha, NE-IA | 51.3% |
| 12. Austin-Round Rock-San Marcos, TX | 49.1% |
| 13. Rochester, NY | 49.1% |
| 14. Providence-Warwick, RI-MA | 48.9% |
| 15. Chicago-Naperville-Elgin, IL-IN | 47.4% |
| Bottom Large Metros | Percent* |
|---|---|
| 1. Fresno, CA | 8.4% |
| 2. Jacksonville, FL | 13.8% |
| 3. Birmingham, AL | 15.5% |
| 4. Tulsa, OK | 16.4% |
| 5. Las Vegas-Henderson-North Las Vegas, NV | 16.8% |
| 6. Virginia Beach-Chesapeake-Norfolk, VA-NC | 19.6% |
| 7. Houston-Pasadena-The Woodlands, TX | 19.8% |
| 8. Tucson, AZ | 21.0% |
| 9. Oklahoma City, OK | 22.0% |
| 10. Indianapolis-Carmel-Greenwood, IN | 22.2% |
| 11. San Antonio-New Braunfels, TX | 26.0% |
| 12. Sacramento-Roseville-Folsom, CA | 26.1% |
| 13. Riverside-San Bernardino-Ontario, CA | 26.5% |
| 14. Charlotte-Concord-Gastonia, NC-SC | 26.9% |
| 15. Nashville-Davidson–Murfreesboro–Franklin, TN | 27.8% |
| Top Midsize Metros | Percent* |
|---|---|
| 1. New Haven, CT | 81.2% |
| 2. Bridgeport-Stamford-Danbury, CT | 73.8% |
| 3. Kiryas Joel-Poughkeepsie-Newburgh, NY | 73.6% |
| 4. Madison, WI | 71.2% |
| 5. Oxnard-Thousand Oaks-Ventura, CA | 69.7% |
| 6. Worcester, MA | 61.5% |
| 7. Huntington-Ashland, WV-KY-OH | 60.8% |
| 8. Trenton-Princeton, NJ | 59.2% |
| 9. Davenport-Moline-Rock Island, IA-IL | 58.4% |
| 10. Urban Honolulu, HI | 56.9% |
| 11. Eugene-Springfield, OR | 56.0% |
| 12. Anchorage, AK | 53.5% |
| 13. Ann Arbor, MI | 53.3% |
| 14. Asheville, NC | 53.2% |
| 15. Greensboro-High Point, NC | 53.0% |
| Bottom Midsize Metros | Percent* |
|---|---|
| 1. Shreveport-Bossier City, LA | 0.0% |
| 2. Stockton-Lodi, CA | 0.2% |
| 3. Gulfport-Biloxi, MS | 0.3% |
| 4. Myrtle Beach-Conway-North Myrtle Beach, SC | 0.8% |
| 5. Lafayette, LA | 0.9% |
| 6. Spartanburg, SC | 1.2% |
| 7. Jackson, MS | 1.5% |
| 8. Youngstown-Warren, OH | 3.3% |
| 9. Pensacola-Ferry Pass-Brent, FL | 4.3% |
| 10. Montgomery, AL | 4.9% |
| 11. Corpus Christi, TX | 5.3% |
| 12. Modesto, CA | 7.6% |
| 13. Port St. Lucie, FL | 7.6% |
| 14. Boise City, ID | 8.9% |
| 15. Ocala, FL | 9.8% |
| Top Small Metros | Percent* |
|---|---|
| 1. Boulder, CO | 73.8% |
| 2. Helena, MT | 73.7% |
| 3. Elmira, NY | 72.0% |
| 4. Bloomington, IN | 69.5% |
| 5. Binghamton, NY | 69.2% |
| 6. Dubuque, IA | 68.8% |
| 7. Lafayette-West Lafayette, IN | 67.9% |
| 8. Mankato, MN | 67.4% |
| 9. Rochester, MN | 66.9% |
| 10. Midland, MI | 66.9% |
| 11. Fairbanks-College, AK | 66.7% |
| 12. Bowling Green, KY | 64.9% |
| 13. Eau Claire, WI | 60.7% |
| 14. Green Bay, WI | 60.7% |
| 15. Champaign-Urbana, IL | 60.4% |
| Bottom Small Metros | Percent* |
|---|---|
| 1. Beckley, WV | 0.0% |
| 2. Gettysburg, PA | 0.0% |
| 3. Pinehurst-Southern Pines, NC | 0.0% |
| 4. Weirton-Steubenville, WV-OH | 0.0% |
| 5. Decatur, AL | 0.0% |
| 6. Bay City, MI | 0.0% |
| 7. Pueblo, CO | 0.0% |
| 8. Charleston, WV | 0.0% |
| 9. St. Joseph, MO-KS | 0.0% |
| 10. Redding, CA | 0.0% |
| 11. Rome, GA | 0.0% |
| 12. Santa Fe, NM | 0.0% |
| 13. Terre Haute, IN | 0.0% |
| 14. Odessa, TX | 0.0% |
| 15. Hattiesburg, MS | 0.0% |
Top & Bottom States for Multi-Family Housing Construction
| Top States | Percent* |
|---|---|
| 1. New York | 77.5% |
| 2. Connecticut | 64.1% |
| 3. Massachusetts | 60.8% |
| 4. New Jersey | 57.6% |
| 5. Alaska | 56.8% |
| 6. Rhode Island | 53.0% |
| 7. Washington | 49.3% |
| 8. Illinois | 49.2% |
| 9. Vermont | 47.1% |
| 10. Nebraska | 46.0% |
| 11. Wisconsin | 45.9% |
| 12. South Dakota | 45.9% |
| 13. Kentucky | 45.2% |
| 14. Ohio | 43.4% |
| 15. Montana | 43.4% |
| Bottom States | Percent* |
|---|---|
| 1. Mississippi | 4.6% |
| 2. Delaware | 12.7% |
| 3. South Carolina | 13.8% |
| 4. New Mexico | 14.3% |
| 5. Louisiana | 15.3% |
| 6. Idaho | 15.9% |
| 7. Alabama | 15.9% |
| 8. West Virginia | 16.1% |
| 9. Oklahoma | 20.1% |
| 10. Nevada | 22.6% |
| 11. Maine | 22.9% |
| 12. Wyoming | 23.6% |
| 13. Indiana | 24.6% |
| 14. Utah | 26.1% |
| 15. North Carolina | 26.4% |
*Share of new housing units authorized in multi-family structures
Full Results
Methodology
The data used in this analysis is from the U.S. Census Bureau’s 2024 Building Permit Survey and 2024 American Community Survey. To determine the locations building the most multi-family housing, researchers at Construction Coverage calculated the share of new privately-owned housing units authorized by building permits in multi-family structures (two or more units) in 2024. In the event of a tie, the location with the greater share of existing housing units in multi-family structures was ranked higher. The proportion of existing housing units in multi-family structures was calculated using American Community Survey data and excludes mobile homes, boats, RVs, and other similar types of housing. To improve relevance, only metropolitan areas with complete data available from both sources were included. Additionally, metros were grouped into cohorts by population: small (less than 350,000), midsize (350,000–999,999), and large (1,000,000 or more).
References
- Freddie Mac (November 26, 2024). Housing Supply: Still Undersupplied by Millions of Units. https://www.freddiemac.com/research/insight/housing-supply-still-undersupplied.
- National Multifamily Housing Council (2019). Multifamily Benefits. https://housingtoolkit.nmhc.org/wp-content/uploads/2019/04/D_NMHC_PDF-Sections_Multifamily-Benefits_PG-36-TO-44.pdf.
- Hettervig, R. (October 13, 2025). Landmark Housing Legislation Passes in Senate. National Association of Realtors. https://www.nar.realtor/magazine/real-estate-news/landmark-housing-legislation-passes-in-senate.
- Lee, Y., et al. (April 19, 2019). Urban revival by Millennials? Intraurban net migration patterns of young adults, 1980–2010. Journal of Regional Science. https://onlinelibrary.wiley.com/doi/10.1111/jors.12445.
- U.S. Census Bureau (2024). Building Permits Survey. https://www.census.gov/construction/bps/index.html.
- U.S. Census Bureau (2024). American Community Survey. https://www.census.gov/programs-surveys/acs.