U.S. Cities With the Highest Income Limits for Affordable Housing [2021 Edition]
As the U.S. begins to emerge from the COVID-19 pandemic and work towards economic recovery, one of the major economic issues to watch in the months and years ahead is housing. The pandemic has in some ways increased economic inequality, and trends in housing show it. Many high earners are using favorable mortgage interest rates and record household savings during the pandemic to buy from unusually low inventories of homes, creating fierce competition among buyers and driving home prices higher. Meanwhile, low-income workers have relied on government stimulus, rent assistance programs, and eviction moratoriums for nearly a year and a half just to keep a roof over their heads—and many of those programs will likely run out in the next few months.
The current conditions of the housing market are especially stark, and as pandemic relief programs wind down, the ripple effects could be devastating for many families. But underlying issues around affordable housing for low-income families have been apparent for much longer, and COVID-19 has only highlighted the challenges these households face.
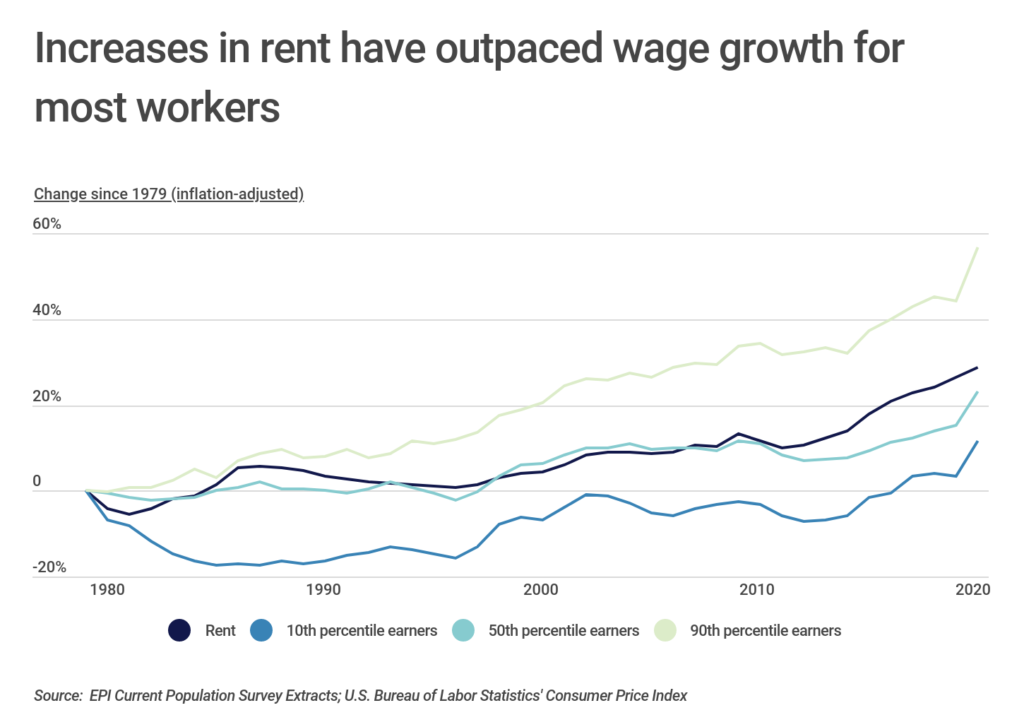
Data from the U.S. Bureau of Labor Statistics shows that rent prices nationally increased by nearly 30% from 1979 to 2020 after adjusting for inflation, and many workers have seen their wage growth fail to keep up. Income for high earners—the 90th percentile—has grown by 57% over the same span, nearly double the growth rate for rent. For earners at the 50th and 10th percentiles, however, wage growth has not kept pace with the increases in housing costs. At the 50th percentile, workers earn 23% more now than in 1980 after adjusting for inflation. For 10th percentile earners, that number is less than 12%, significantly below the increase in housing costs.
FOR CONSTRUCTION PROFESSIONALS
Does your firm work on new residential construction? Be sure to review our recently updated guides on builders risk insurance and commercial auto insurance—two important policies for construction businesses.
For low-income earners, federal housing assistance programs like Section 8 housing vouchers, Section 202 housing for the elderly, and Section 811 housing for persons with disabilities help address affordability challenges. The U.S. Department of Housing and Urban Development sets income thresholds for these programs based on estimates of median family income and market rents at the local level. But even with these programs, many low-income households still struggle to pay for housing due to rising costs, slow wage growth, and limited availability of funding for these programs. According to data from the Center for Budget and Policy Priorities, 24 million low-income renters pay more than half of their income for housing.
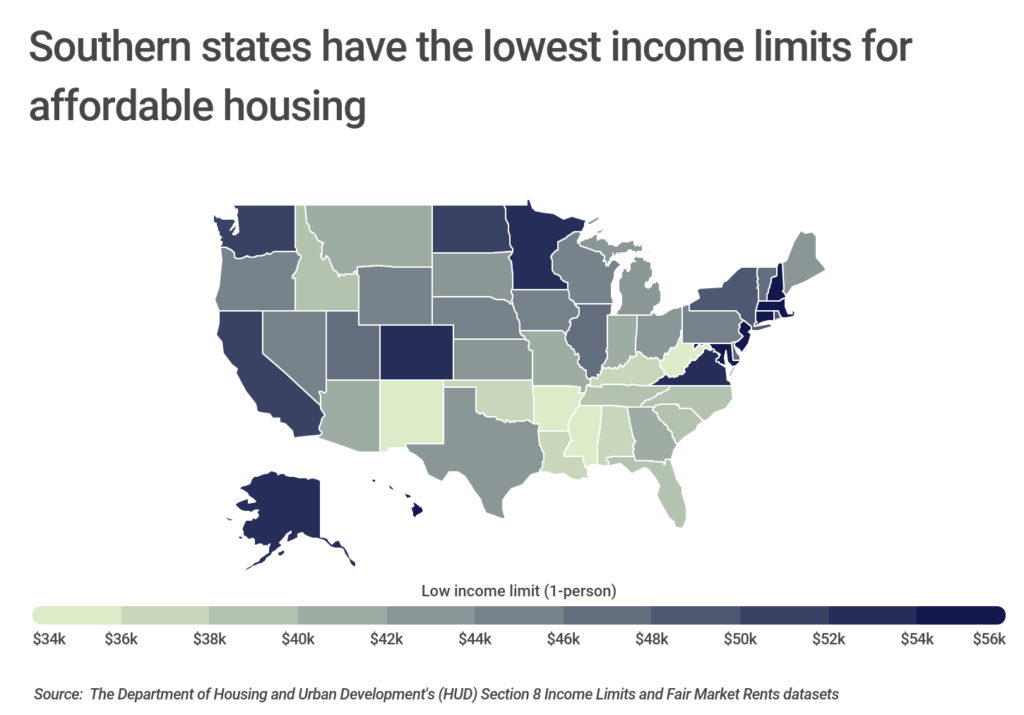
The combination of wage stagnation and rising housing costs are being experienced nearly everywhere in the U.S., but what constitutes affordable housing also often depends where one lives, which is why HUD bases income limits for its housing assistance programs on local market conditions. In some areas, housing costs are so high that HUD’s definition of “low income” for a family of four is over six figures.
At the state level, Mississippi has the lowest limits at $33,600 for an individual and $48,000 for a family of four. Many of Mississippi’s southern neighbors also have low limits, with more than half of the bottom ten states being found in the Southeast. At the opposite end of the spectrum, Massachusetts, Maryland, New Jersey, and Connecticut tie for the highest income limits, defining low-income as $55,950 for a single individual or $79,900 for a family of four.
FOR LANDLORDS
Do you own or manage a large rental property? If so, it’s important to understand the basics of commercial property insurance.
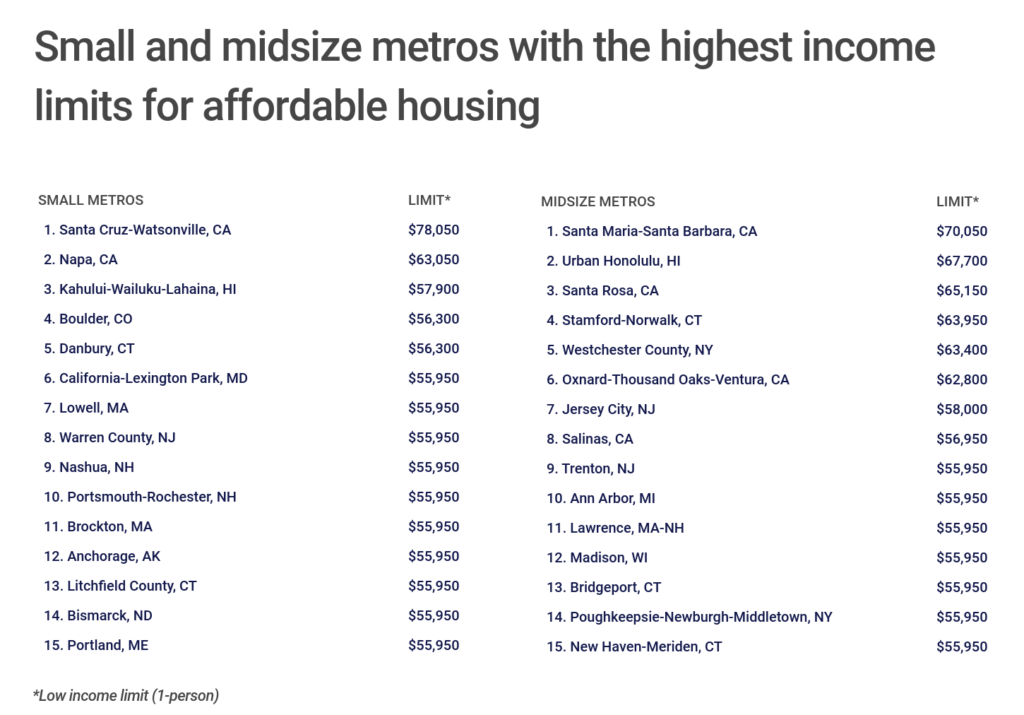
These four states are also represented among the metro areas with the highest income limits for affordable housing, driven by housing costs in expensive metros like Boston, Washington, D.C., and New York City. But the most expensive metros are all found in California: the top four metros are all located in the Golden State, led by San Francisco—the only major metro in the U.S. where the low-income limit for an individual reaches six figures, at $102,450.
To find these locations, researchers at Construction Coverage analyzed the latest data from the Department of Housing and Urban Development’s (HUD) Section 8 Income Limits and Fair Market Rents datasets. The researchers also included low income limits for four-person family households, as well as one- and two-bedroom fair market rents, and the median family income of each location.
Here are the U.S. metropolitan areas with the highest income limits for affordable housing.
Large Metros With the Highest Income Limits for Affordable Housing

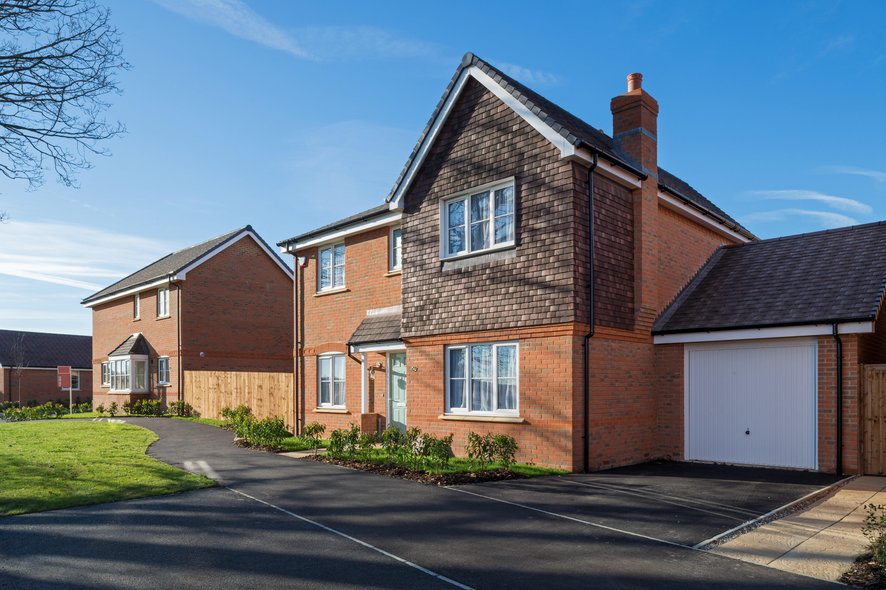
Photo Credit: Alamy Stock Photo
15. Newark, NJ
- Low income limit (1-person): $55,950
- Low income limit (4-person family): $79,900
- 1-bedroom fair market rent: $1,358
- 2-bedroom fair market rent: $1,643
- Median family income: $107,400
FOR CONSTRUCTION PROFESSIONALS
The right construction software can make all the difference when it comes to managing your projects. One of the most important software solutions for construction professionals is construction accounting software, which makes it possible to separately track the finances of individual jobs in an automated way.

Photo Credit: Alamy Stock Photo
14. Monmouth-Ocean, NJ
- Low income limit (1-person): $55,950
- Low income limit (4-person family): $79,900
- 1-bedroom fair market rent: $1,291
- 2-bedroom fair market rent: $1,652
- Median family income: $108,900

Photo Credit: Alamy Stock Photo
13. Middlesex-Somerset-Hunterdon, NJ
- Low income limit (1-person): $57,250
- Low income limit (4-person family): $81,750
- 1-bedroom fair market rent: $1,371
- 2-bedroom fair market rent: $1,753
- Median family income: $123,200

Photo Credit: Alamy Stock Photo
12. Washington-Arlington-Alexandria, DC-VA-MD
- Low income limit (1-person): $57,650
- Low income limit (4-person family): $82,300
- 1-bedroom fair market rent: $1,548
- 2-bedroom fair market rent: $1,765
- Median family income: $129,000

Photo Credit: Alamy Stock Photo
11. Bergen-Passaic, NJ
- Low income limit (1-person): $57,700
- Low income limit (4-person family): $82,400
- 1-bedroom fair market rent: $1,503
- 2-bedroom fair market rent: $1,768
- Median family income: $113,200

Photo Credit: Alamy Stock Photo
10. Seattle-Bellevue, WA
- Low income limit (1-person): $63,350
- Low income limit (4-person family): $90,500
- 1-bedroom fair market rent: $1,599
- 2-bedroom fair market rent: $1,906
- Median family income: $115,700

Photo Credit: Alamy Stock Photo
9. Los Angeles-Long Beach-Glendale, CA
- Low income limit (1-person): $66,250
- Low income limit (4-person family): $94,600
- 1-bedroom fair market rent: $1,605
- 2-bedroom fair market rent: $2,058
- Median family income: $80,000

Photo Credit: Alamy Stock Photo
8. Nassau-Suffolk, NY
- Low income limit (1-person): $66,450
- Low income limit (4-person family): $94,900
- 1-bedroom fair market rent: $1,659
- 2-bedroom fair market rent: $2,035
- Median family income: $129,900

Photo Credit: Alamy Stock Photo
7. New York, NY
- Low income limit (1-person): $66,850
- Low income limit (4-person family): $95,450
- 1-bedroom fair market rent: $1,801
- 2-bedroom fair market rent: $2,053
- Median family income: $81,700
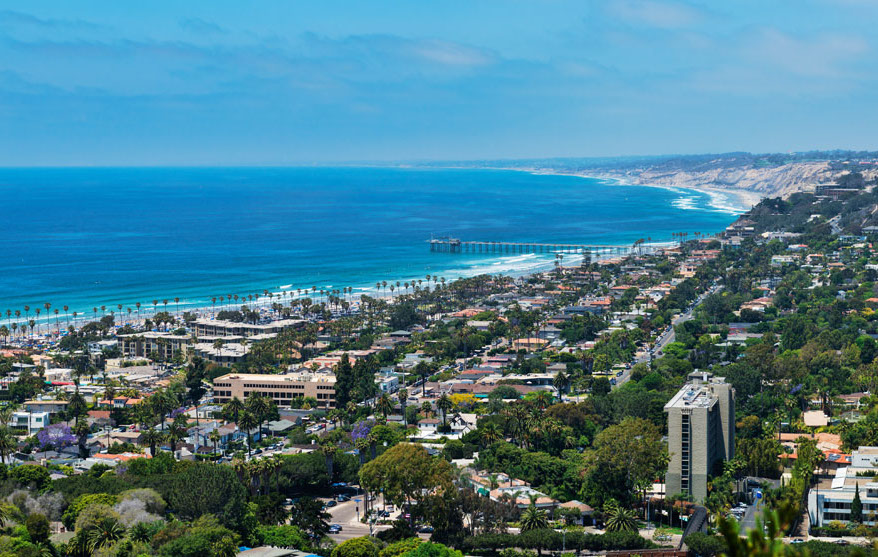
Photo Credit: Alamy Stock Photo
6. San Diego-Carlsbad, CA
- Low income limit (1-person): $67,900
- Low income limit (4-person family): $97,000
- 1-bedroom fair market rent: $1,642
- 2-bedroom fair market rent: $2,124
- Median family income: $95,100

Photo Credit: Alamy Stock Photo
5. Boston-Cambridge-Quincy, MA-NH
- Low income limit (1-person): $70,750
- Low income limit (4-person family): $101,050
- 1-bedroom fair market rent: $1,924
- 2-bedroom fair market rent: $2,336
- Median family income: $120,800

Photo Credit: Alamy Stock Photo
4. Santa Ana-Anaheim-Irvine, CA
- Low income limit (1-person): $75,300
- Low income limit (4-person family): $107,550
- 1-bedroom fair market rent: $1,888
- 2-bedroom fair market rent: $2,331
- Median family income: $106,700

Photo Credit: Alamy Stock Photo
3. Oakland-Fremont, CA
- Low income limit (1-person): $76,750
- Low income limit (4-person family): $109,600
- 1-bedroom fair market rent: $1,934
- 2-bedroom fair market rent: $2,383
- Median family income: $125,600

Photo Credit: Alamy Stock Photo
2. San Jose-Sunnyvale-Santa Clara, CA
- Low income limit (1-person): $82,450
- Low income limit (4-person family): $117,750
- 1-bedroom fair market rent: $2,558
- 2-bedroom fair market rent: $3,051
- Median family income: $151,300

Photo Credit: Alamy Stock Photo
1. San Francisco, CA
- Low income limit (1-person): $102,450
- Low income limit (4-person family): $146,350
- 1-bedroom fair market rent: $2,923
- 2-bedroom fair market rent: $3,553
- Median family income: $149,600
Detailed Findings & Methodology
To find the U.S. locations with the highest income limits for affordable housing, researchers at Construction Coverage analyzed the latest data from the The Department of Housing and Urban Development’s (HUD) Section 8 Income Limits and Fair Market Rents datasets. Metropolitan areas were ranked according to the low income limit for one-person households, which is typically set at 80% of median income in that area. In the event of a tie, the metro with the higher median four-person family income was ranked higher. Researchers also included low income limits for four-person family households, as well as one- and two-bedroom fair market rents, and the median family income of each location.
To improve relevance, only metros with at least 100,000 residents were included in the analysis. Metros were also grouped into the following cohorts based on population size: small (100,000-349,999); midsize (350,000-999,999); and large (1,000,000 or more). State and national data was calculated as a population-weighted average of the county-level data.