U.S. Cities With the Most High-Density Housing [2022 Edition]
High-density housing can provide a number of important benefits to communities and the residents who live there. All else being equal, research suggests that residents in high-density communities tend to be more physically active and healthy. Their costs for utilities and transportation tend to be lower, and as a result, high-density communities may also be more environmentally sustainable as well. Higher concentrations of people also allow local governments to more efficiently support services and infrastructure. And in areas where demand for housing exceeds supply, greater density may help alleviate issues with affordability. But despite the arguments in favor of density, high-density residential construction is not the norm in the United States.
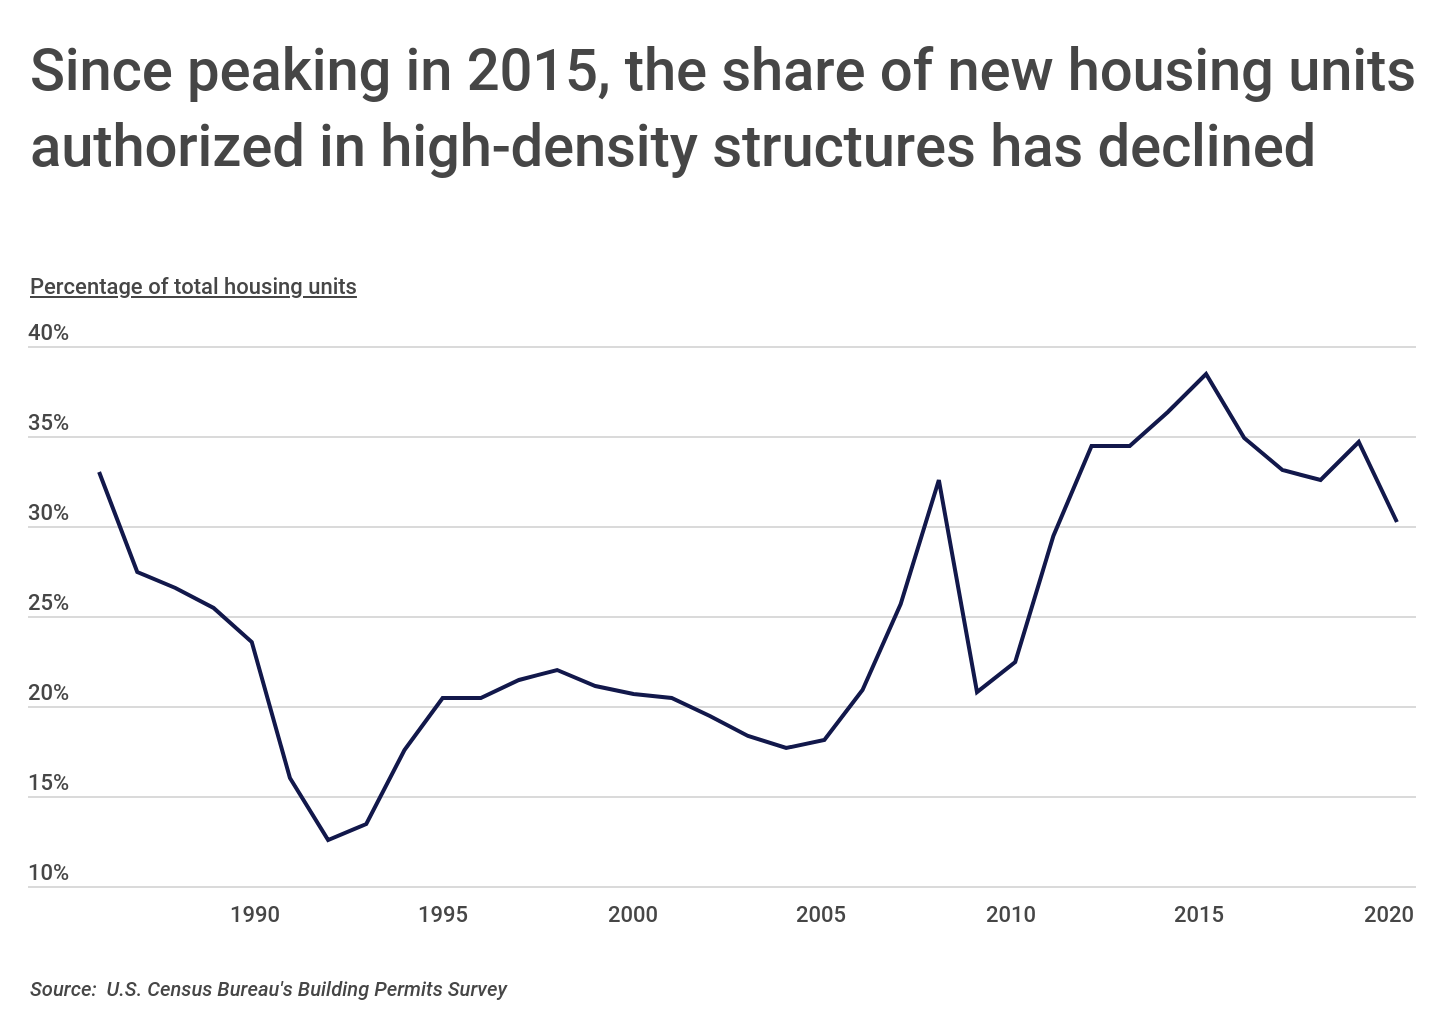
One of the reasons for this is that builders respond to market conditions when determining what types of structures to build. When demand—and prices—for single-family residences are high, builders are less likely to work on high-density projects. For example, the share of housing units authorized in high-density structures fell below 20% at the height of the housing bubble in the mid-2000s but then spiked to more than 32% when the bubble burst. For most of the decade after the Great Recession, high-density units accounted for about one-third of new authorized units, peaking at 38.4% in 2015. More recently, however, that share has begun to decline, and post-pandemic housing trends—including a greater demand for larger suburban homes—could accelerate that decline further.
FOR PROPERTY OWNERS
When performing renovations on an apartment building, it’s critical to have the appropriate level of builders risk insurance, as commercial property insurance typically won’t cover a building under construction.
Despite the benefits of higher-density communities, Americans generally prefer the opposite, with nearly 90% of homebuyers saying they would rather live in a single-family home than a higher-density structure. And many homeowners prefer not to live near high-density housing either. The term NIMBY (“not in my backyard”) refers to the mindset of homeowners who might support an initiative in theory, but oppose it occuring in their neighborhood based on concern over factors like property values, aesthetics, parking, and safety and privacy. Coordinated efforts from NIMBY groups can often lead higher-density projects to be eliminated or moved to different areas.
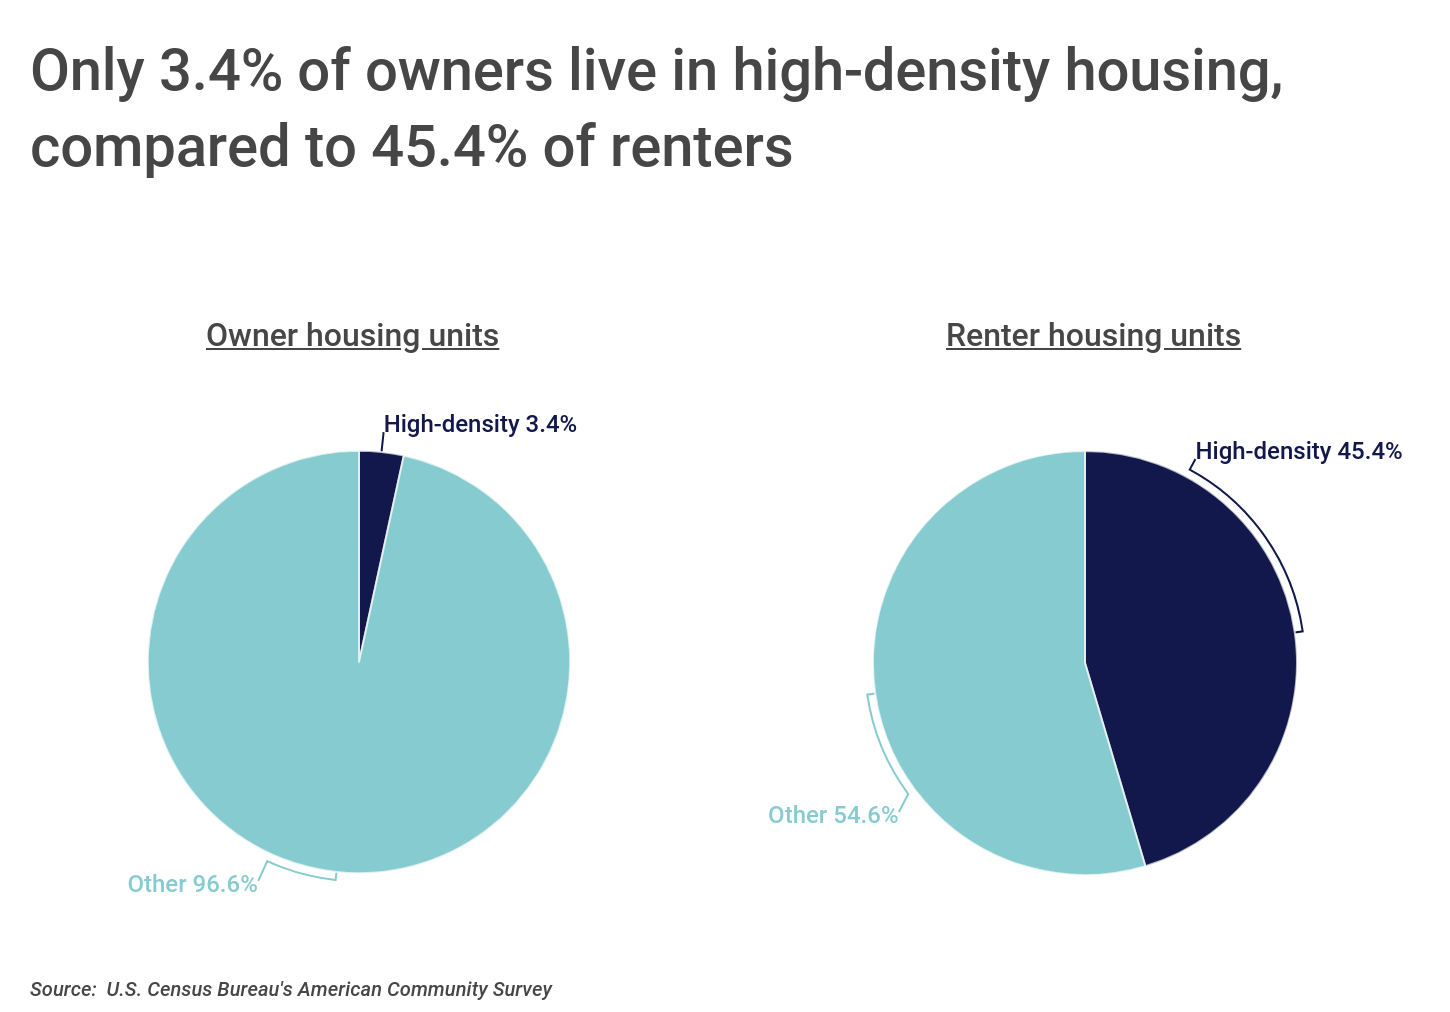
Opponents of NIMBY efforts note that these efforts can reflect or reinforce racial and socioeconomic disparities within a community. For example, only 3.4% of homeowners live in high-density housing, while 45% of renters live in a high-density structure. When homeowners—who usually have greater resources than renters—oppose efforts to increase density in a neighborhood, it places constraints on supply, which increases existing property values and places greater financial burdens on aspiring homeowners and renters.
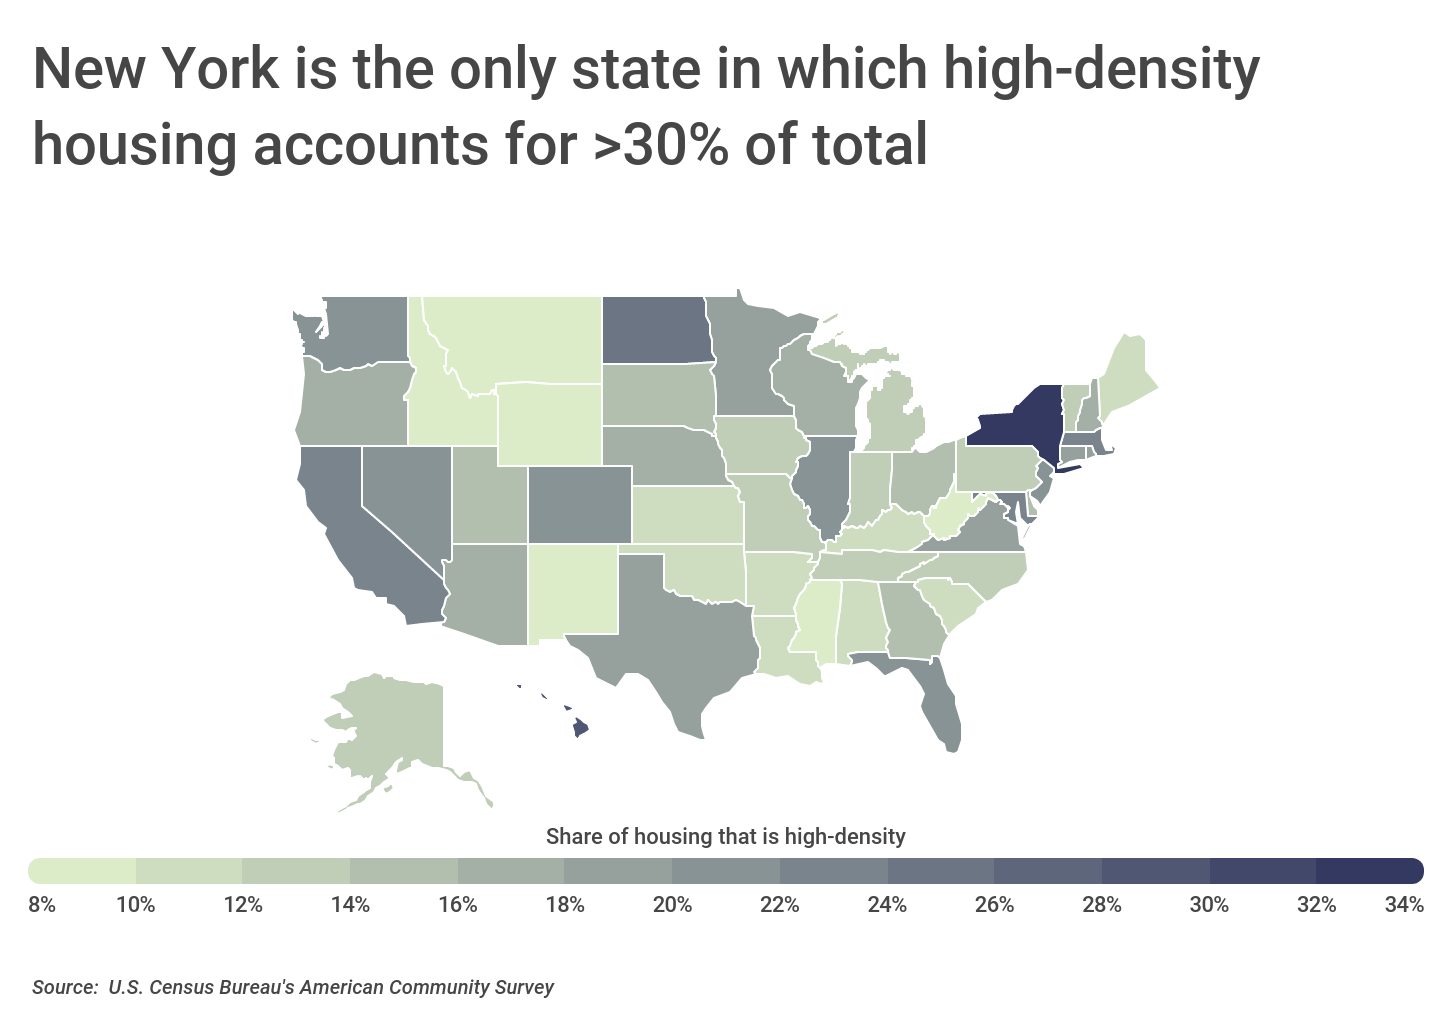
High-density housing tends to be most common in locations that have large urban areas or otherwise large populations. While there are some smaller rural states like North Dakota that have relatively high shares of high-density housing, coastal states and others that are home to large metros have the most. New York leads all states with 34.9% of housing in high-density structures, with other dense states like California (23.9%) and Massachusetts (22.2%) also ranking highly. These state rankings are driven by major metro areas like New York City in New York, San Francisco and Los Angeles in California, and Boston in Massachusetts where demand for housing is high, creating greater need for density.
The data used in this analysis is from the U.S. Census Bureau’s American Community Survey. To determine the locations with the most people living in high-density housing, researchers at Construction Coverage calculated the proportion of all housing units that are in high-density structures. High-density was defined to be structures with five housing units or more. Researchers also calculated the share of owner- and renter-occupied housing in high-density structures.
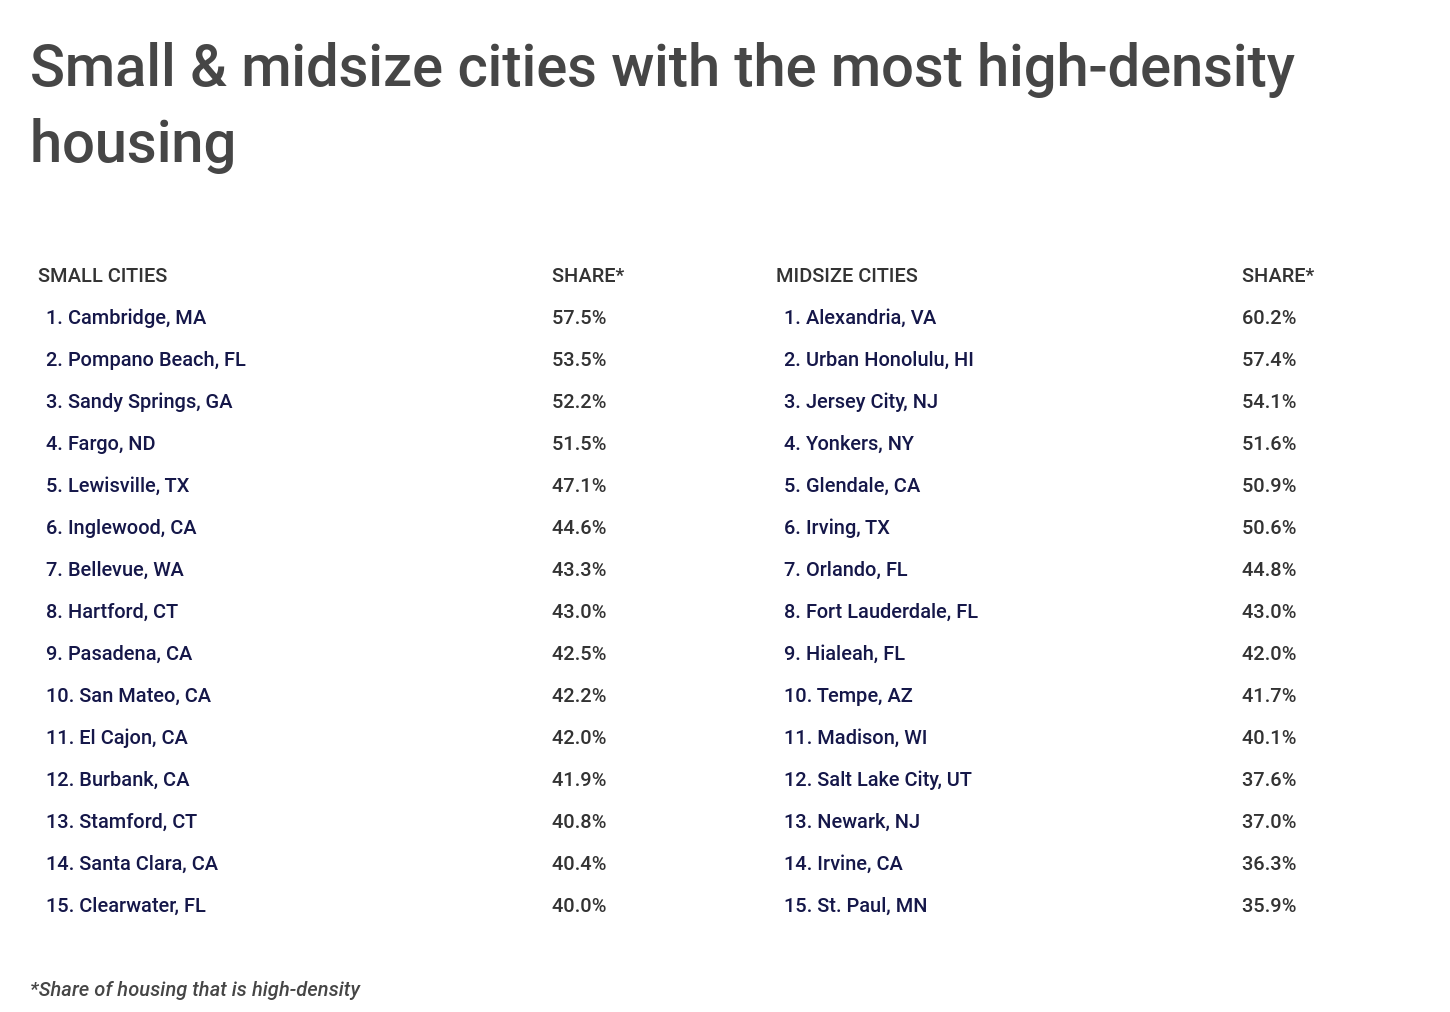
Here are the cities with the most people living in high-density housing.
Large Cities With the Most High-Density Housing

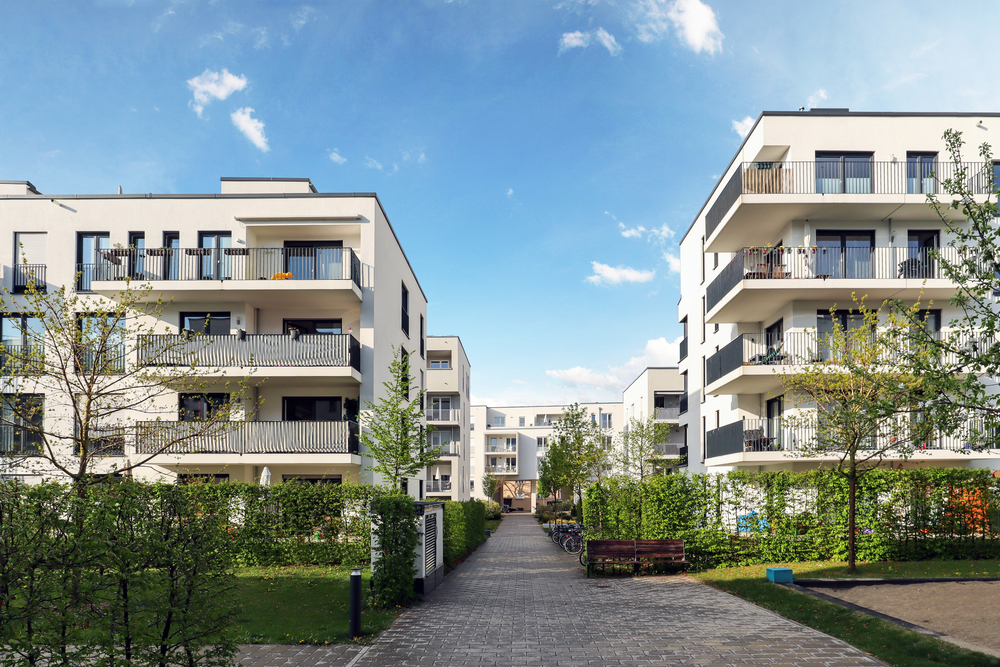
Photo Credit: Dancestrokes / Shutterstock
15. San Diego, CA
- Share of housing that is high-density: 37.3%
- Share of owner housing that is high-density: 12.5%
- Share of renter housing that is high-density: 58.8%
- Total high-density housing units: 191,090
- Total housing units: 512,530
FOR PROPERTY MANAGERS
If you or your workers regularly use personal vehicles for business, they must be covered under a commercial auto insurance policy. Depending on the types of vehicles being used, a dedicated commercial truck insurance policy might be the best fit.

Photo Credit: Sean Pavone / Shutterstock
14. Austin, TX
- Share of housing that is high-density: 39.4%
- Share of owner housing that is high-density: 5.0%
- Share of renter housing that is high-density: 67.0%
- Total high-density housing units: 161,685
- Total housing units: 409,903

Photo Credit: photo.ua / Shutterstock
13. Minneapolis, MN
- Share of housing that is high-density: 41.6%
- Share of owner housing that is high-density: 11.6%
- Share of renter housing that is high-density: 67.8%
- Total high-density housing units: 75,621
- Total housing units: 181,833

Photo Credit: Roschetzky Photography / Shutterstock
12. Denver, CO
- Share of housing that is high-density: 41.8%
- Share of owner housing that is high-density: 14.4%
- Share of renter housing that is high-density: 69.1%
- Total high-density housing units: 133,191
- Total housing units: 318,445

Photo Credit: Oleg Podzorov / Shutterstock
11. Chicago, IL
- Share of housing that is high-density: 42.0%
- Share of owner housing that is high-density: 25.1%
- Share of renter housing that is high-density: 55.4%
- Total high-density housing units: 453,883
- Total housing units: 1,080,345
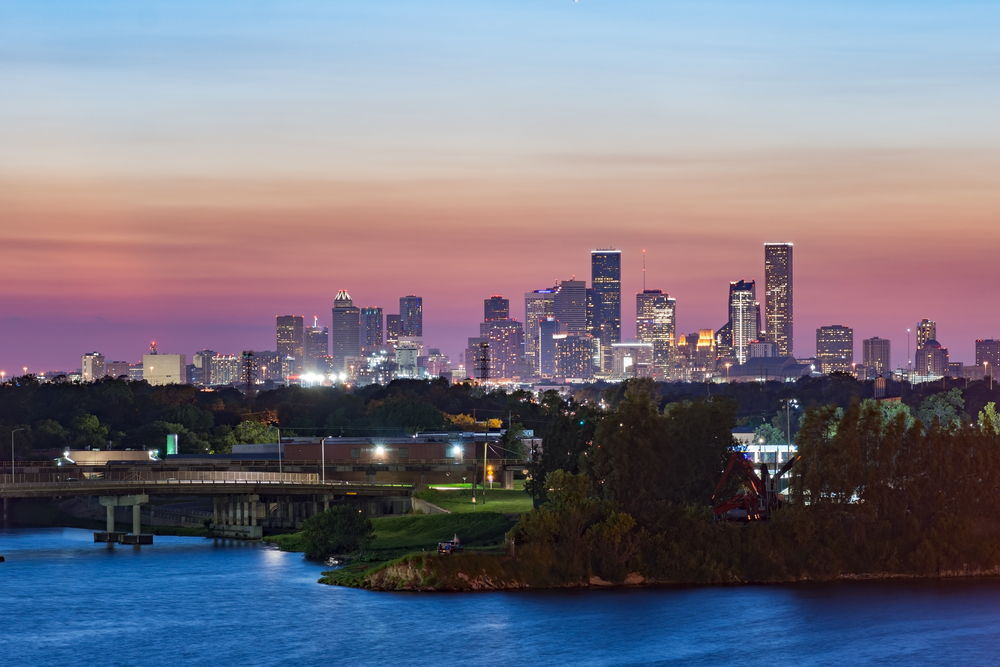
Photo Credit: nektofadeev / Shutterstock
10. Houston, TX
- Share of housing that is high-density: 44.2%
- Share of owner housing that is high-density: 5.1%
- Share of renter housing that is high-density: 70.7%
- Total high-density housing units: 387,650
- Total housing units: 876,504

Photo Credit: Travellaggio / Shutterstock
9. Boston, MA
- Share of housing that is high-density: 44.9%
- Share of owner housing that is high-density: 24.7%
- Share of renter housing that is high-density: 55.7%
- Total high-density housing units: 122,024
- Total housing units: 271,553

Photo Credit: f11photo / Shutterstock
8. Dallas, TX
- Share of housing that is high-density: 45.8%
- Share of owner housing that is high-density: 6.5%
- Share of renter housing that is high-density: 72.7%
- Total high-density housing units: 237,596
- Total housing units: 518,998

Photo Credit: Chones / Shutterstock
7. Los Angeles, CA
- Share of housing that is high-density: 47.2%
- Share of owner housing that is high-density: 11.3%
- Share of renter housing that is high-density: 67.9%
- Total high-density housing units: 660,197
- Total housing units: 1,398,900
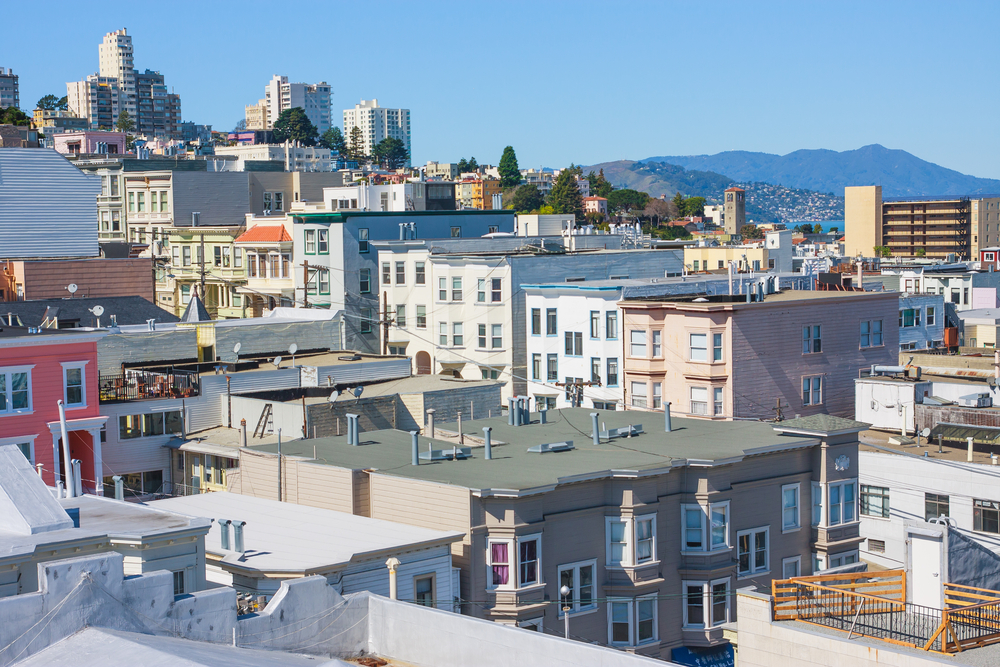
Photo Credit: Radoslaw Lecyk / Shutterstock
6. San Francisco, CA
- Share of housing that is high-density: 47.8%
- Share of owner housing that is high-density: 17.9%
- Share of renter housing that is high-density: 65.4%
- Total high-density housing units: 174,716
- Total housing units: 365,851
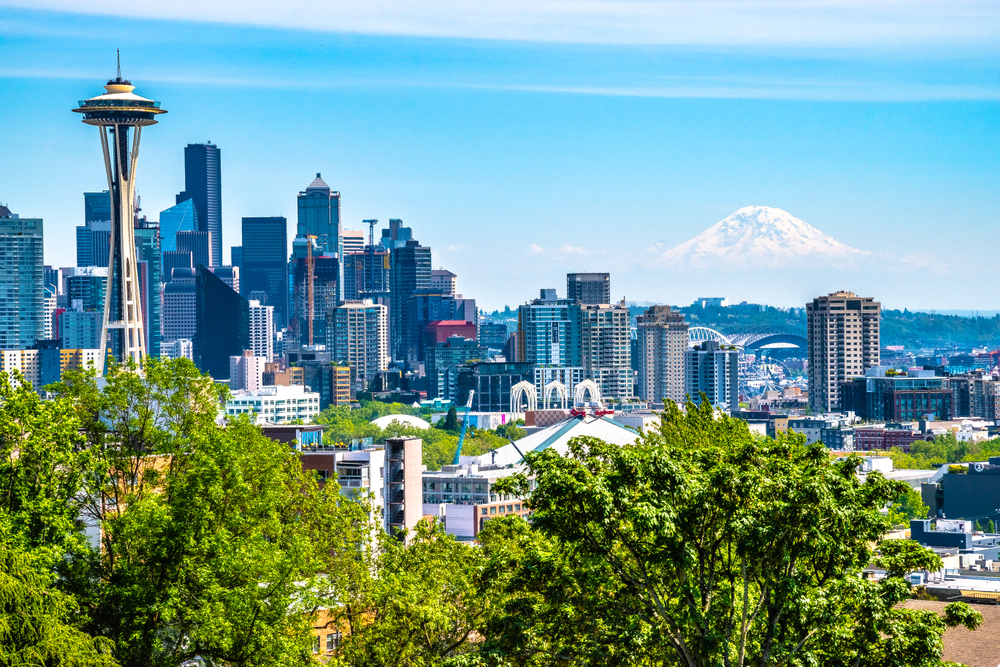
Photo Credit: Jeremy Janus / Shutterstock
5. Seattle, WA
- Share of housing that is high-density: 47.9%
- Share of owner housing that is high-density: 14.7%
- Share of renter housing that is high-density: 73.8%
- Total high-density housing units: 164,814
- Total housing units: 343,988
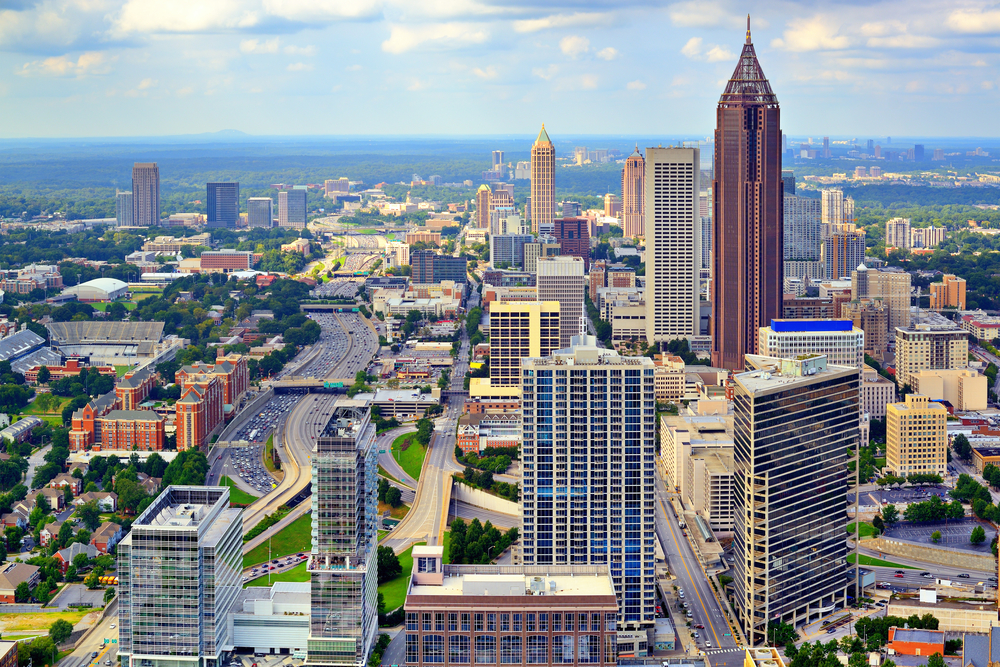
Photo Credit: ESB Professional / Shutterstock
4. Atlanta, GA
- Share of housing that is high-density: 49.9%
- Share of owner housing that is high-density: 24.1%
- Share of renter housing that is high-density: 72.5%
- Total high-density housing units: 111,737
- Total housing units: 223,736

Photo Credit: A G Baxter / Shutterstock
3. Washington, D.C.
- Share of housing that is high-density: 53.9%
- Share of owner housing that is high-density: 24.6%
- Share of renter housing that is high-density: 74.7%
- Total high-density housing units: 157,237
- Total housing units: 291,570

Photo Credit: Just dance / Shutterstock
2. Miami, FL
- Share of housing that is high-density: 56.4%
- Share of owner housing that is high-density: 28.3%
- Share of renter housing that is high-density: 68.2%
- Total high-density housing units: 106,629
- Total housing units: 189,084

Photo Credit: Lukas Uher / Shutterstock
1. New York, NY
- Share of housing that is high-density: 62.0%
- Share of owner housing that is high-density: 33.4%
- Share of renter housing that is high-density: 75.4%
- Total high-density housing units: 1,992,401
- Total housing units: 3,211,033
Detailed Findings & Methodology
The data used in this analysis is from the U.S. Census Bureau’s 2019 American Community Survey. To determine the locations with the most people living in high-density housing, researchers calculated the proportion of all housing units that are in high-density structures. High-density was defined to be structures with five housing units or more. In the event of a tie, researchers considered the share of owner- and renter-occupied housing in high-density structures. To improve relevance, only cities with at least 100,000 residents were included. Additionally, cities were grouped into cohorts based on population size: small (100,000-149,999), midsize (150,000-349,999), and large (350,000 or more).