
U.S. Cities With the Most Mortgage Refinances
Note: This is the most recent release of our U.S. Cities With the Most Mortgage Refinances study. To see data from previous years, please visit the Full Results section below.
As mortgage interest rates remain elevated above pre-pandemic levels, mortgage refinancing applications continue to decline after refinancing exploded in 2020 and 2021 during the pandemic.
Most commonly, mortgage refinancing allows a homeowner to replace their existing loan with a new loan at a lower interest rate or different term length. Certain types of refinancing agreements can also enable the homeowner to receive cash in exchange for accrued home equity. The mortgage refinance industry is acutely sensitive to changes in the overall U.S. economy, so as economic conditions continue to change, the mortgage refinancing landscape will shift as well.
Composition of U.S. Mortgage Refinances
Mortgage refinances have declined well below pre-pandemic levels
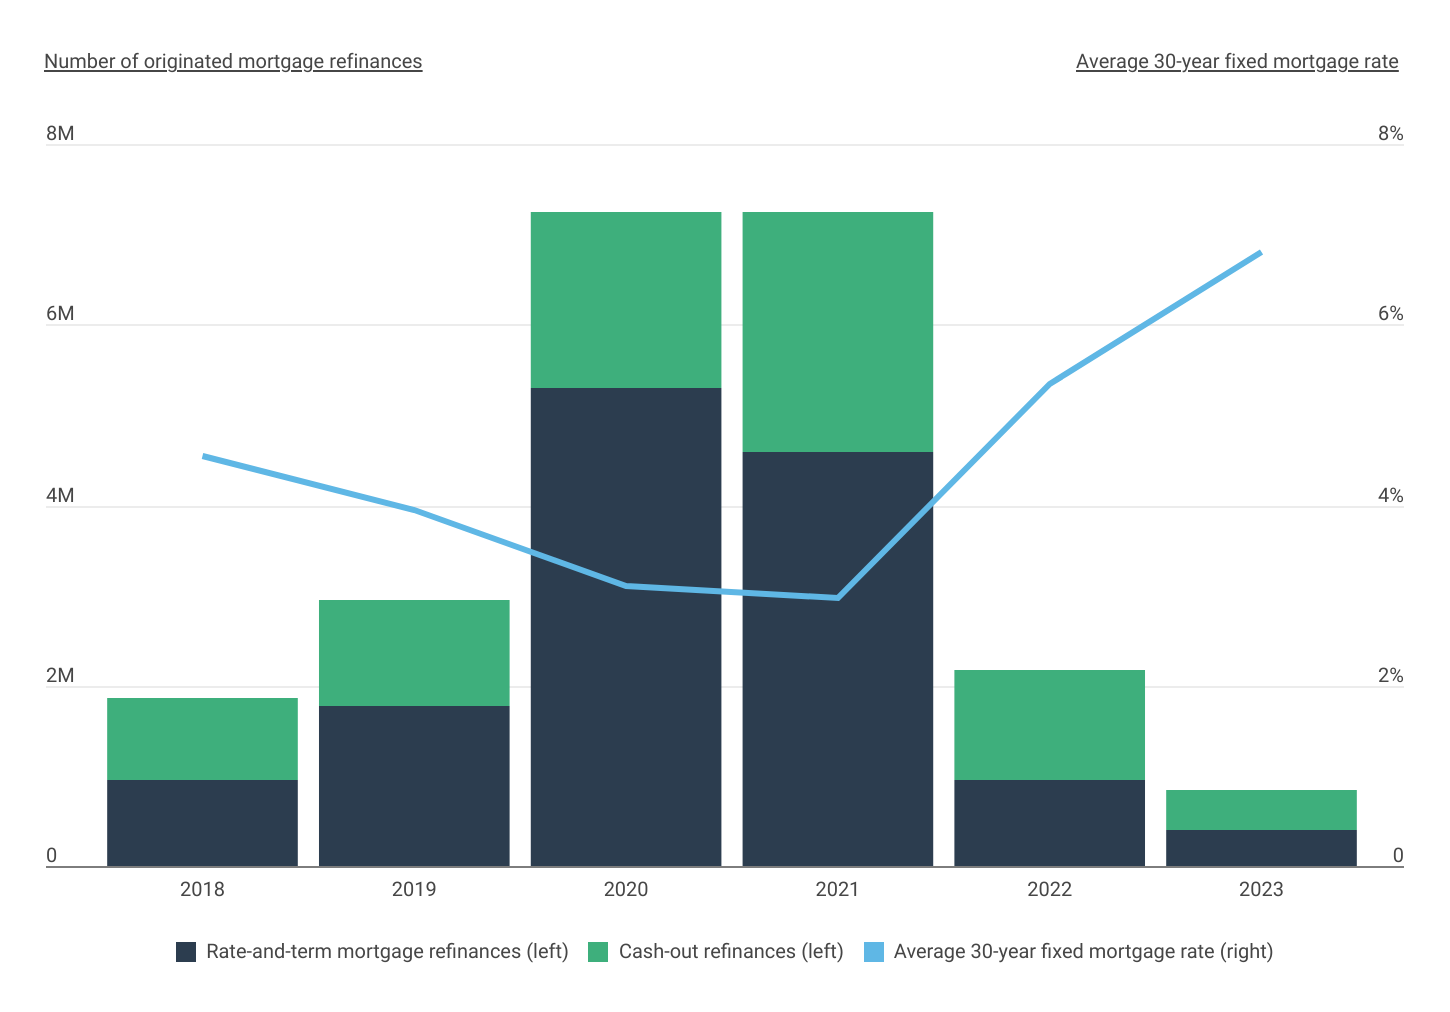
Due primarily to historically low interest rates, mortgage refinances skyrocketed in 2020, increasing a whopping 146% from 2019 and remaining at similar levels in 2021. However, in 2022, mortgage refinances regressed back to pre-pandemic levels—declining nearly 70% to a total of approximately 2.2 million refinances. In 2023, refinances declined even further—down another 61% to just over 841,000. Notably, the composition of mortgage refinances shifted as well. Driven by a historic runup in home sale value during COVID, the majority of all mortgage refinances in 2022 and 2023 were cash-out as homeowners looked to draw on their newfound home equity.
FOR CONSTRUCTION PROFESSIONALS
Do you run a general contracting business? If so, choosing the right contractor accounting software can help you manage your cash flow and better understand the revenue and expenses associated with each project.
Most Common Denial Reasons for Mortgage Refinance Applications
Inadequate debt-to-income ratio is the most common reason for denied refinancing
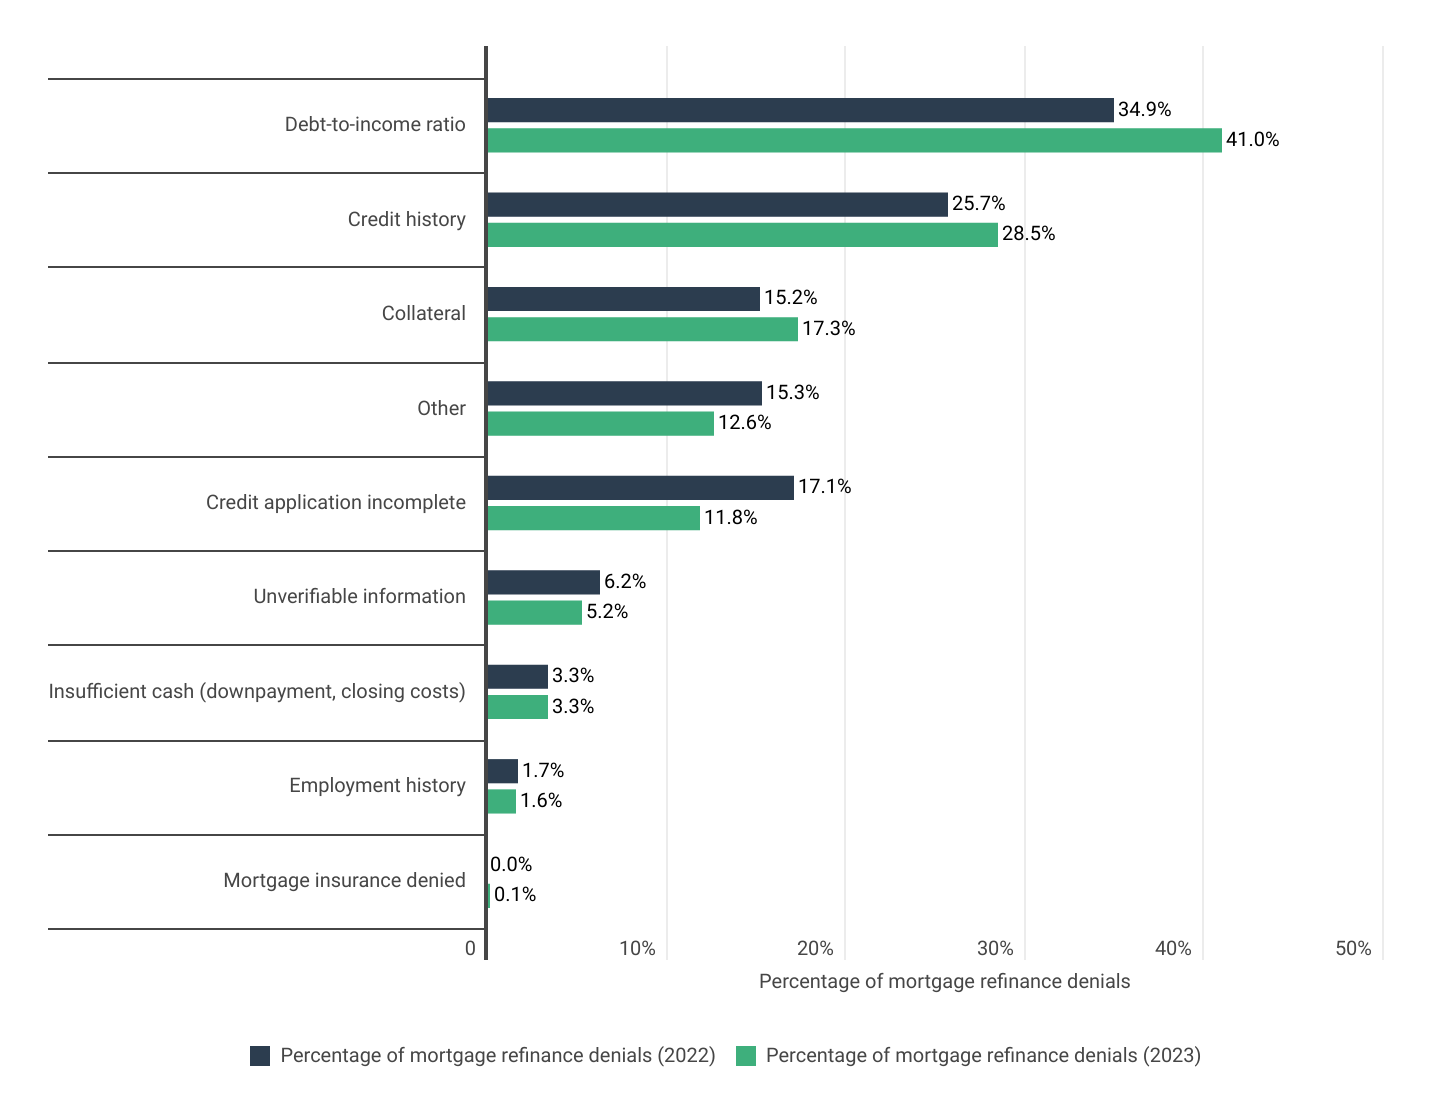
Although refinancing a mortgage can help reduce monthly payments or provide some much needed liquidity, not all refinancing applications are approved. In 2023, approximately 73% of mortgage refinance applications were approved by the lender, while 27% were denied for one or multiple reasons. The most common reason for denial was an inadequate debt-to-income ratio, cited in 41% of all denied applications—a rise of over 6 percentage points from the previous year. Credit history was the second most common reason, mentioned in over one in four denials and also more frequently than the prior year.
Mortgage Refinances by Location
Mortgage refinancing is most popular in Utah and Wisconsin
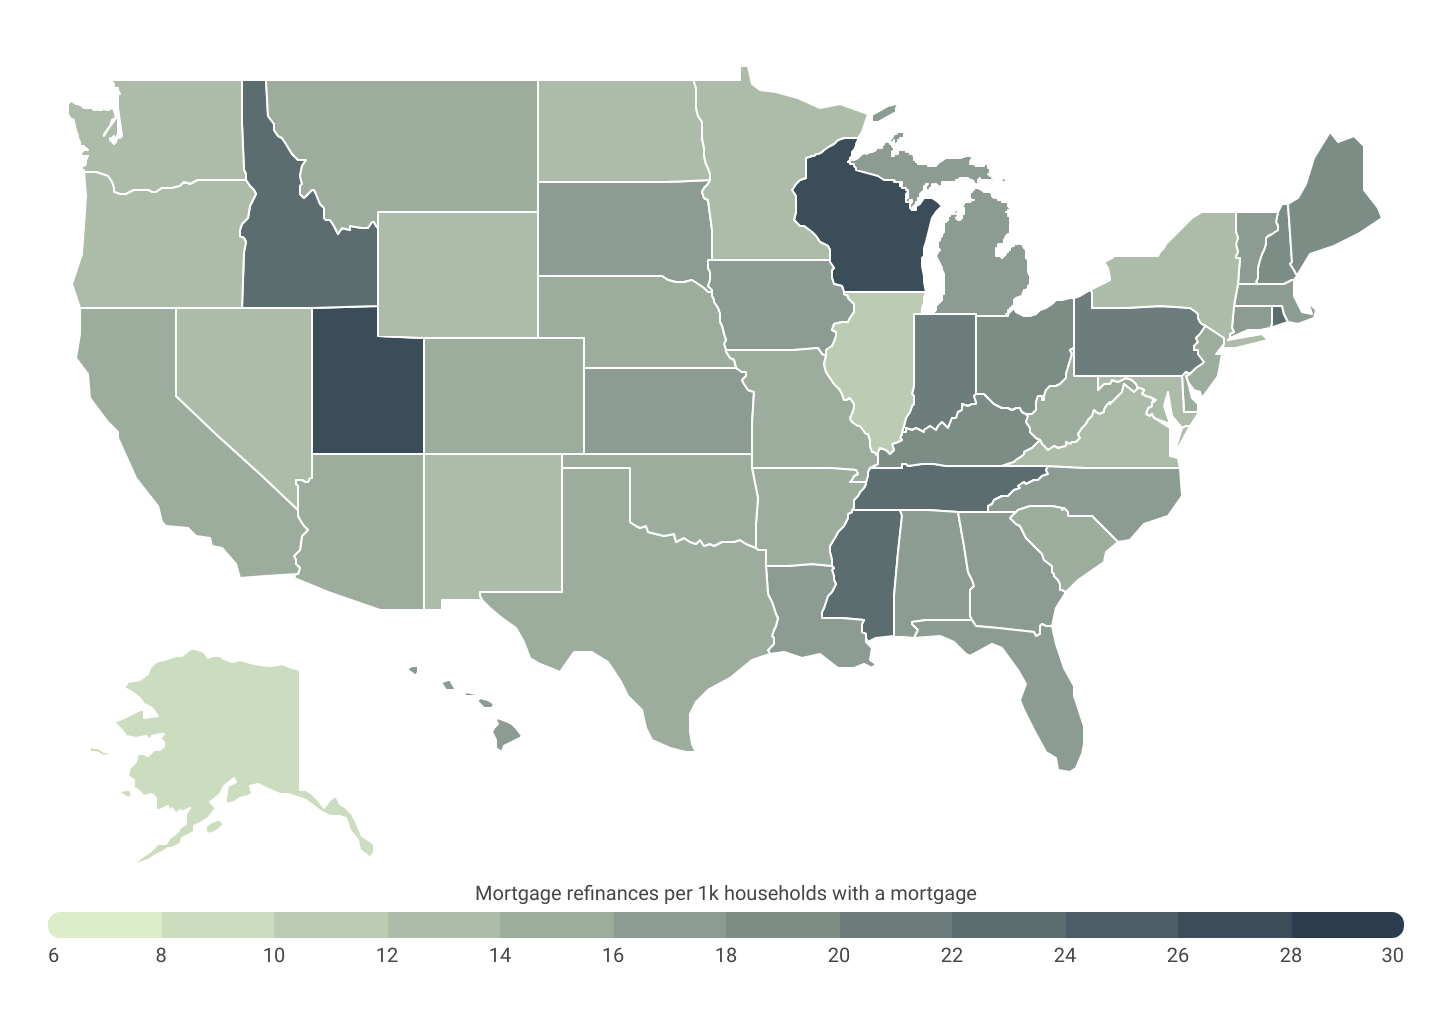
The proportion of households that refinance their mortgage varies considerably across regions of the country. Out of all 50 states, Utah had the most mortgage refinances in 2023 at 27.5 refinances per 1,000 households with a mortgage, followed by Wisconsin (26.7) and Rhode Island (23.4). In the U.S. overall, there were 16.3 mortgage refinances originated per 1,000 households with mortgages in 2023. At the other end of the spectrum, Alaska had the fewest with just 8.7 refinances per 1,000 mortgaged households.
At the metropolitan level, many of the same trends hold true. Utah and Wisconsin are well represented, with metros from either state claiming the top two spots in small, midsize, and large metro cohort rankings. Salt Lake City-Murray, UT (26.1) and Milwaukee-Waukesha, WI (23.9) outpace all large metros for mortgage refinances relative to the number of homes.
Below is a complete breakdown of mortgage refinances in 2023 across more than 380 metropolitan areas, grouped by size, and all 50 states. The analysis was conducted by researchers at Construction Coverage, using data from the Federal Financial Institutions Examination Council and the U.S. Census Bureau. For more information on how each statistic was computed, refer to the methodology section below.
Cities With the Most Mortgage Refinances
| Top Large Metros | Refinances* |
|---|---|
| 1. Salt Lake City-Murray, UT | 26.1 |
| 2. Milwaukee-Waukesha, WI | 23.9 |
| 3. Columbus, OH | 21.8 |
| 4. Providence-Warwick, RI-MA | 21.8 |
| 5. Grand Rapids-Wyoming-Kentwood, MI | 21.7 |
| 6. Nashville-Davidson–Murfreesboro–Franklin, TN | 21.5 |
| 7. Rochester, NY | 21.4 |
| 8. Pittsburgh, PA | 20.7 |
| 9. San Antonio-New Braunfels, TX | 20.5 |
| 10. Louisville/Jefferson County, KY-IN | 20.3 |
| 11. Jacksonville, FL | 20.0 |
| 12. Philadelphia-Camden-Wilmington, PA-NJ-DE-MD | 19.7 |
| 13. Charlotte-Concord-Gastonia, NC-SC | 19.3 |
| 14. Indianapolis-Carmel-Greenwood, IN | 19.1 |
| 15. Cleveland, OH | 19.1 |
| Bottom Large Metros | Refinances* |
|---|---|
| 1. Washington-Arlington-Alexandria, DC-VA-MD-WV | 10.6 |
| 2. Minneapolis-St. Paul-Bloomington, MN-WI | 11.3 |
| 3. Chicago-Naperville-Elgin, IL-IN | 11.4 |
| 4. San Jose-Sunnyvale-Santa Clara, CA | 11.9 |
| 5. Sacramento-Roseville-Folsom, CA | 12.0 |
| 6. San Francisco-Oakland-Fremont, CA | 12.4 |
| 7. New York-Newark-Jersey City, NY-NJ | 12.4 |
| 8. Fresno, CA | 12.5 |
| 9. Virginia Beach-Chesapeake-Norfolk, VA-NC | 12.6 |
| 10. Seattle-Tacoma-Bellevue, WA | 12.7 |
| 11. Las Vegas-Henderson-North Las Vegas, NV | 12.8 |
| 12. Portland-Vancouver-Hillsboro, OR-WA | 12.8 |
| 13. Houston-Pasadena-The Woodlands, TX | 12.9 |
| 14. St. Louis, MO-IL | 13.2 |
| 15. Tucson, AZ | 13.6 |
| Top Midsize Metros | Refinances* |
|---|---|
| 1. Madison, WI | 39.7 |
| 2. Ogden, UT | 29.1 |
| 3. Knoxville, TN | 26.0 |
| 4. Provo-Orem-Lehi, UT | 25.7 |
| 5. Canton-Massillon, OH | 24.2 |
| 6. Youngstown-Warren, OH | 22.4 |
| 7. Jackson, MS | 22.0 |
| 8. Springfield, MO | 22.0 |
| 9. Gulfport-Biloxi, MS | 22.0 |
| 10. Wichita, KS | 21.0 |
| 11. Hickory-Lenoir-Morganton, NC | 20.9 |
| 12. Akron, OH | 20.8 |
| 13. Boise City, ID | 20.6 |
| 14. Lancaster, PA | 20.6 |
| 15. Reading, PA | 20.6 |
| Bottom Midsize Metros | Refinances* |
|---|---|
| 1. Anchorage, AK | 8.5 |
| 2. Visalia, CA | 10.7 |
| 3. Colorado Springs, CO | 11.0 |
| 4. Vallejo, CA | 11.1 |
| 5. Lansing-East Lansing, MI | 11.3 |
| 6. Santa Rosa-Petaluma, CA | 11.3 |
| 7. Little Rock-North Little Rock-Conway, AR | 11.8 |
| 8. Tallahassee, FL | 11.9 |
| 9. Stockton-Lodi, CA | 12.0 |
| 10. Augusta-Richmond County, GA-SC | 12.2 |
| 11. Bakersfield-Delano, CA | 12.3 |
| 12. Spartanburg, SC | 12.4 |
| 13. Modesto, CA | 12.4 |
| 14. Reno, NV | 12.8 |
| 15. Salem, OR | 13.0 |
| Top Small Metros | Refinances* |
|---|---|
| 1. Green Bay, WI | 33.3 |
| 2. Janesville-Beloit, WI | 32.2 |
| 3. St. George, UT | 31.4 |
| 4. Morristown, TN | 31.3 |
| 5. La Crosse-Onalaska, WI-MN | 30.2 |
| 6. Wausau, WI | 30.2 |
| 7. Florence-Muscle Shoals, AL | 30.2 |
| 8. Owensboro, KY | 29.7 |
| 9. Fond du Lac, WI | 29.0 |
| 10. Appleton, WI | 28.4 |
| 11. Logan, UT-ID | 27.7 |
| 12. Iowa City, IA | 27.3 |
| 13. Barnstable Town, MA | 27.1 |
| 14. Idaho Falls, ID | 27.1 |
| 15. South Bend-Mishawaka, IN-MI | 26.9 |
| Bottom Small Metros | Refinances* |
|---|---|
| 1. Midland, TX | 6.3 |
| 2. Fairbanks-College, AK | 7.1 |
| 3. Odessa, TX | 7.1 |
| 4. Laredo, TX | 8.0 |
| 5. Casper, WY | 8.3 |
| 6. Decatur, IL | 8.3 |
| 7. Jacksonville, NC | 8.3 |
| 8. Eagle Pass, TX | 8.8 |
| 9. Victoria, TX | 8.8 |
| 10. Farmington, NM | 8.9 |
| 11. Paducah, KY-IL | 9.6 |
| 12. Las Cruces, NM | 10.2 |
| 13. Minot, ND | 10.6 |
| 14. Corvallis, OR | 10.6 |
| 15. College Station-Bryan, TX | 10.8 |
States With the Most Mortgage Refinances
| Top States | Refinances* |
|---|---|
| 1. Utah | 27.5 |
| 2. Wisconsin | 26.7 |
| 3. Rhode Island | 23.4 |
| 4. Mississippi | 22.8 |
| 5. Idaho | 22.7 |
| 6. Tennessee | 22.1 |
| 7. Indiana | 20.8 |
| 8. Pennsylvania | 20.0 |
| 9. Kentucky | 19.4 |
| 10. Ohio | 19.1 |
| 11. New Hampshire | 18.9 |
| 12. Maine | 18.2 |
| 13. North Carolina | 17.9 |
| 14. Michigan | 17.8 |
| 15. Alabama | 17.8 |
| Bottom States | Refinances* |
|---|---|
| 1. Alaska | 8.7 |
| 2. Illinois | 11.7 |
| 3. New Mexico | 12.0 |
| 4. Minnesota | 12.0 |
| 5. Nevada | 12.8 |
| 6. Virginia | 13.0 |
| 7. Oregon | 13.1 |
| 8. Maryland | 13.1 |
| 9. New York | 13.6 |
| 10. Wyoming | 13.7 |
| 11. Washington | 13.8 |
| 12. North Dakota | 13.9 |
| 13. South Carolina | 14.1 |
| 14. California | 14.2 |
| 15. Montana | 14.4 |
*Mortgage refinances per 1k households with a mortgage
Full Results
Methodology
To find the locations with the most mortgage refinances, researchers at Construction Coverage analyzed the latest data from the Federal Financial Institutions Examination Council’s 2023 Home Mortgage Disclosure Act and the U.S. Census Bureau’s 2023 American Community Survey. The researchers ranked metros according to the number of mortgage refinances originated in 2023 per 1,000 households with a mortgage. Only conventional refinances for single-family dwellings were considered for this analysis. In the event of a tie, the location with the larger total number of originated mortgage refinances was ranked higher. To improve relevance, metropolitan areas were grouped into the following cohorts based on population size: small (less than 350,000), midsize (350,000–999,999), and large (1,000,000 or more).
References
- Freddie Mac (November 27, 2024). 30-Year Fixed Rate Mortgage Average in the United States. https://fred.stlouisfed.org/series/MORTGAGE30US.
- Mortgage Bankers Association (November 6, 2024). Mortgage Applications Decrease in Latest MBA Weekly Survey. https://www.mba.org/news-and-research/newsroom/news/2024/11/06/mortgage-applications-decrease-in-latest-mba-weekly-survey.
- U.S. Census Bureau and U.S. Department of Housing and Urban Development (October 24, 2024). Median Sales Price of Houses Sold for the United States. https://fred.stlouisfed.org/series/MSPUS.
- Consumer Financial Protection Bureau (2024). Mortgage data (HMDA). https://www.consumerfinance.gov/data-research/hmda/.
- U.S. Census Bureau (2024). American Community Survey. https://www.census.gov/programs-surveys/acs.