
Construction Sectors With the Biggest Increase in Spending Since COVID-19 [2022 Edition]
Nearly two years into the COVID-19 pandemic, the ongoing spread of the virus and an uneven economic recovery have hobbled some sectors while others continue to experience rapid growth. One of the industries in the latter group is construction.
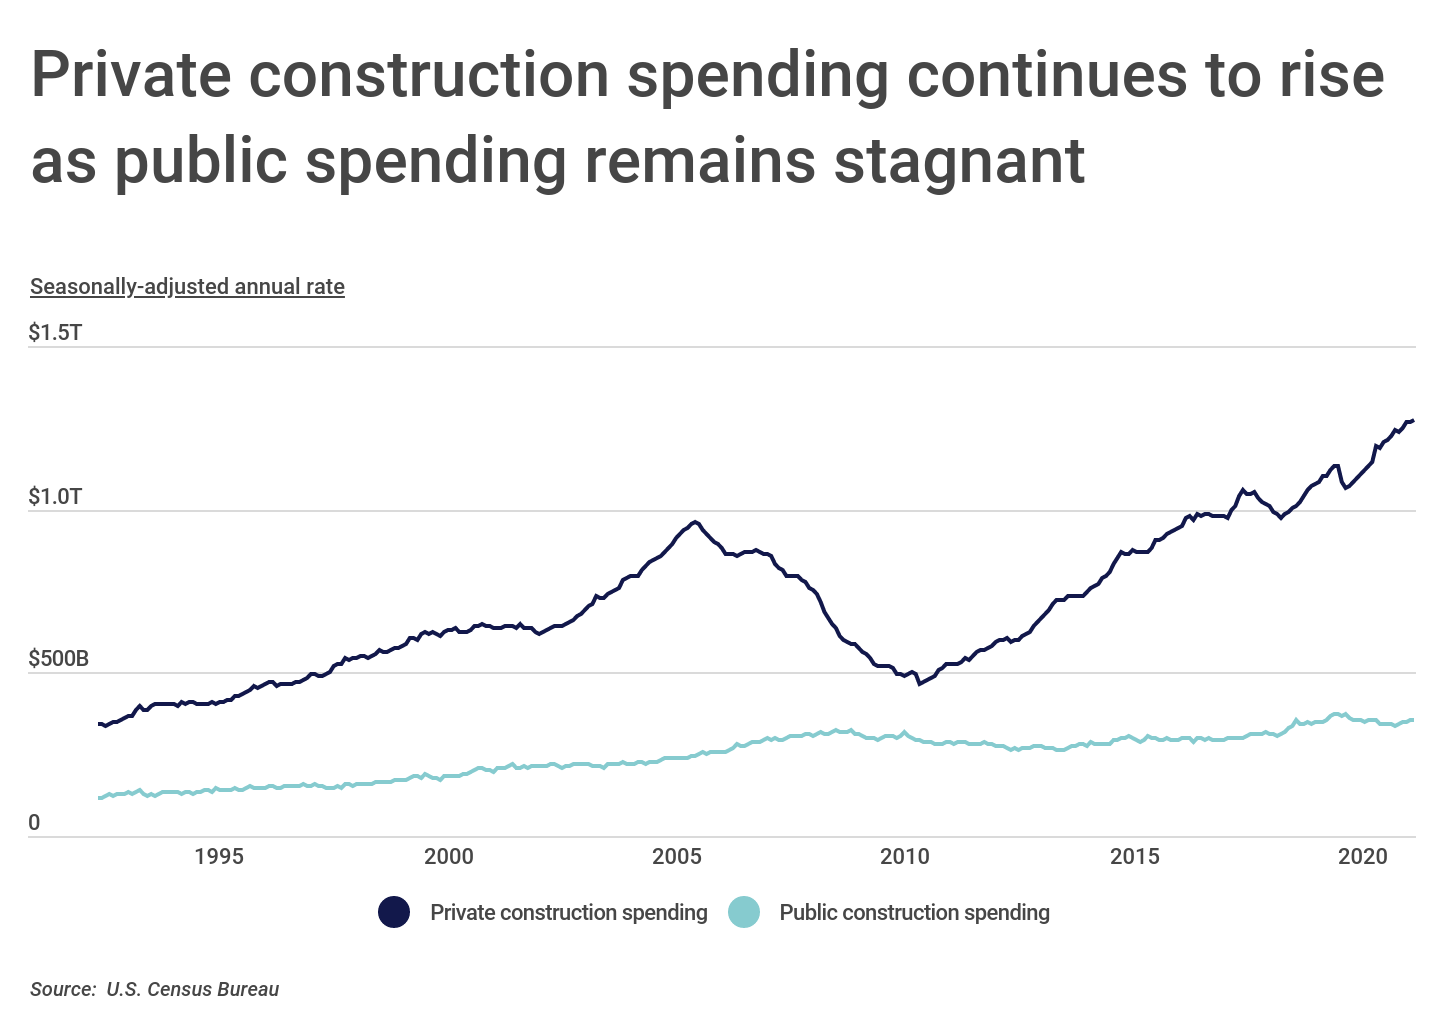
Recent data from the U.S. Census Bureau found that seasonally-adjusted U.S. spending on construction increased by 9.3% from November 2020 to November 2021. Both supply and demand are helping drive spending upward. On the supply side, building materials have seen increases in prices amid ongoing supply chain struggles, and the cost of labor has also increased as employers look to compete for workers in a tight labor market. On the demand side, many consumers and businesses are flush with cash due in part to aggressive fiscal relief from the federal government and strong economic performance in some sectors, which has given them the means to invest in major expenses like construction.
FOR CONSTRUCTION PROFESSIONALS
Before starting a new project, make sure to read Construction Coverage’s recently updated guides on builders risk insurance and inland marine insurance. While builders risk insurance protects buildings while under construction, inland marine insurance typically protects tools and equipment in transit.
Most of the recent growth has originated in the private sector. From January 2020—just before much of the economy shut down due to COVID—to now, public construction spending actually declined by around 4%, while private constructing spending increased by nearly 14% over the same span. This continues a trend of strong growth in the private sector since the Great Recession, as total private sector construction spending has grown to more than 3.5 times that of the public sector.
However, public spending could trend upward again in the near future. The American Rescue Plan passed last March included more than $360 billion for state and local governments to use for various projects, which many have elected to spend on infrastructure improvements. In November, Congress passed and President Joe Biden signed into law a $1 trillion package that will fund a wide variety of infrastructure projects nationwide. As these dollars flow out, construction spending on public projects is likely to rise.
RELATED
As construction firms expand, most will quickly outgrow manual accounting techniques or traditional accounting software. This is because construction accounting methods (like job costing) differ markedly from those used in other industries.
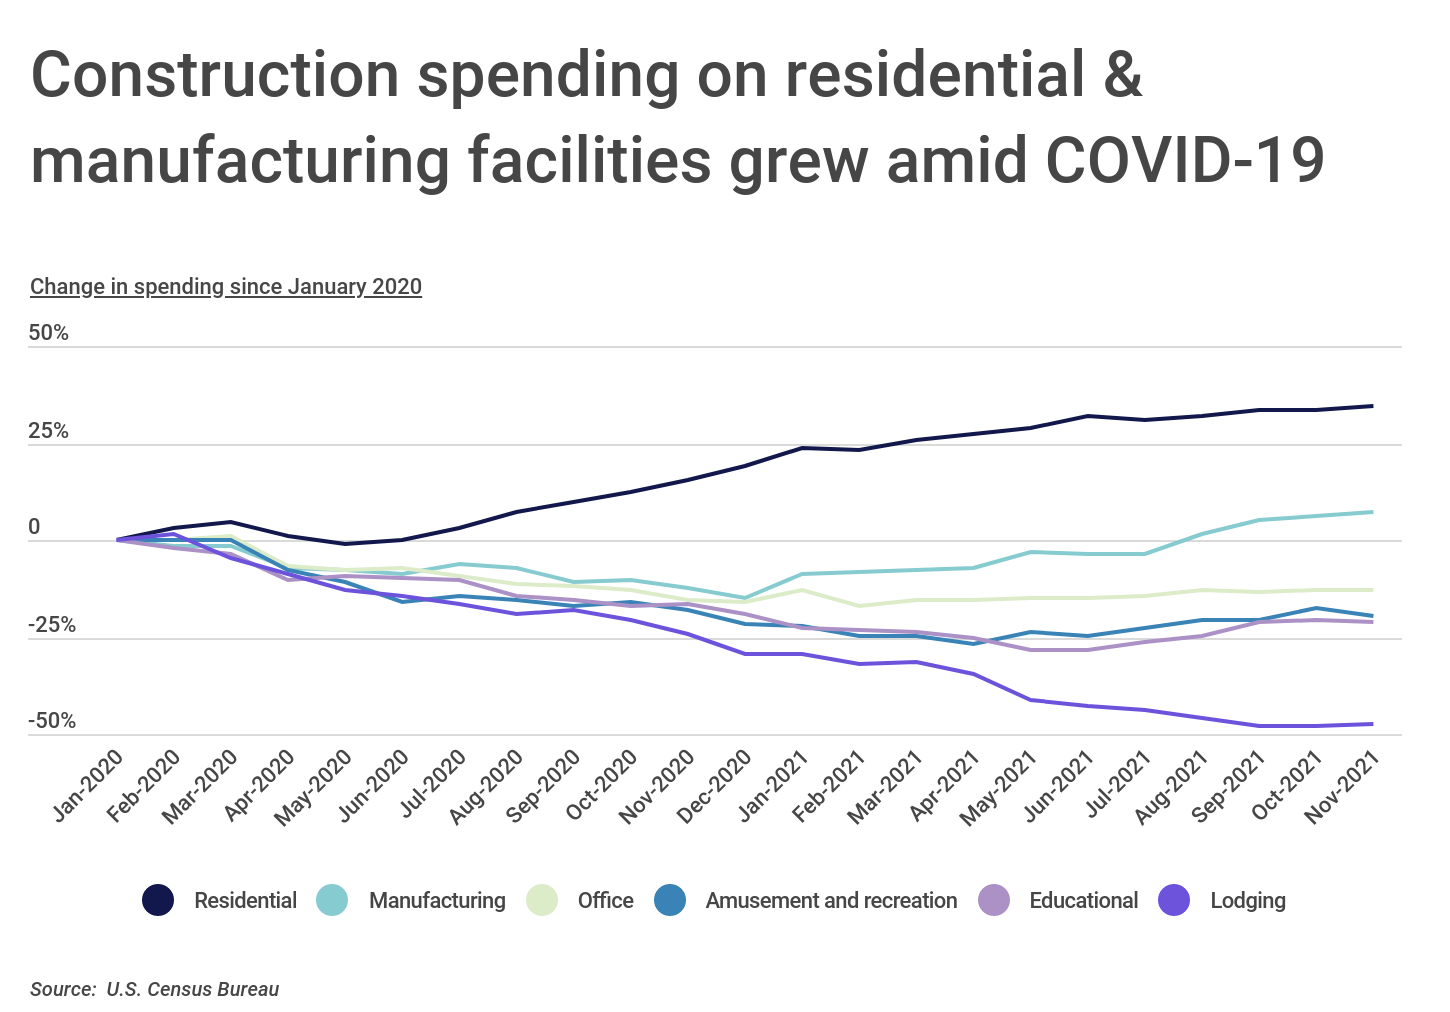
Overall, however, construction spending has mirrored trends in the economy since the beginning of the pandemic. Spending in broad categories like offices (-12.9%) has fallen with more employers adjusting to remote or hybrid work arrangements, while spending on construction for lodging (-47.4%) and amusement and recreation (-19.5%) has fallen due to continued struggles for travel, tourism, and recreation businesses.
In contrast, the category with the biggest growth has been residential construction—up by more than 34% since the beginning of 2020—amid an extremely hot market for real estate. Construction spending on manufacturing has also increased by a more modest 7.3% overall, with most of the growth occurring since many of the economy’s supply chain challenges became apparent last summer. At a more granular level, the more narrowly-defined construction sectors with the most growth since COVID began are also found in manufacturing.
The data used in this analysis is from the U.S. Census Bureau. To identify the construction sectors with the biggest increase in spending since COVID-19 started, researchers at Construction Coverage calculated the percentage change in annualized spending between January 2020 and November of 2021. Researchers also included the total change in spending on an annualized basis.
Here are the construction sectors with the biggest increase in spending since COVID.
Construction Sectors With the Largest Growth in Spending
Photo Credit: ersin ergin / Shutterstock
15. Air transportation
- Percentage change in spending since January 2020: +4.0%
- Total change in spending since January 2020: +$145,000,000
- Total spending (current): $3,784,000,000
- Total spending (January 2020): $3,639,000,000
- Description: Passenger terminals, runways, pavement and lighting, hangars, air freight terminals, space facilities, air traffic towers, aircraft storage and maintenance buildings.

Photo Credit: Engineer studio / Shutterstock
14. Medical buildings
- Percentage change in spending since January 2020: +4.4%
- Total change in spending since January 2020: +$559,000,000
- Total spending (current): $13,365,000,000
- Total spending (January 2020): $12,806,000,000
- Description: Clinics, medical offices, medical labs, doctor and dentist offices, outpatient clinics, and research labs.
RELATED
Construction workers are often surprised to learn that personal car insurance doesn’t cover them while using their vehicles for work. Having a commercial truck insurance policy, which is a more specific form of commercial auto insurance, is recommended for most contractors.
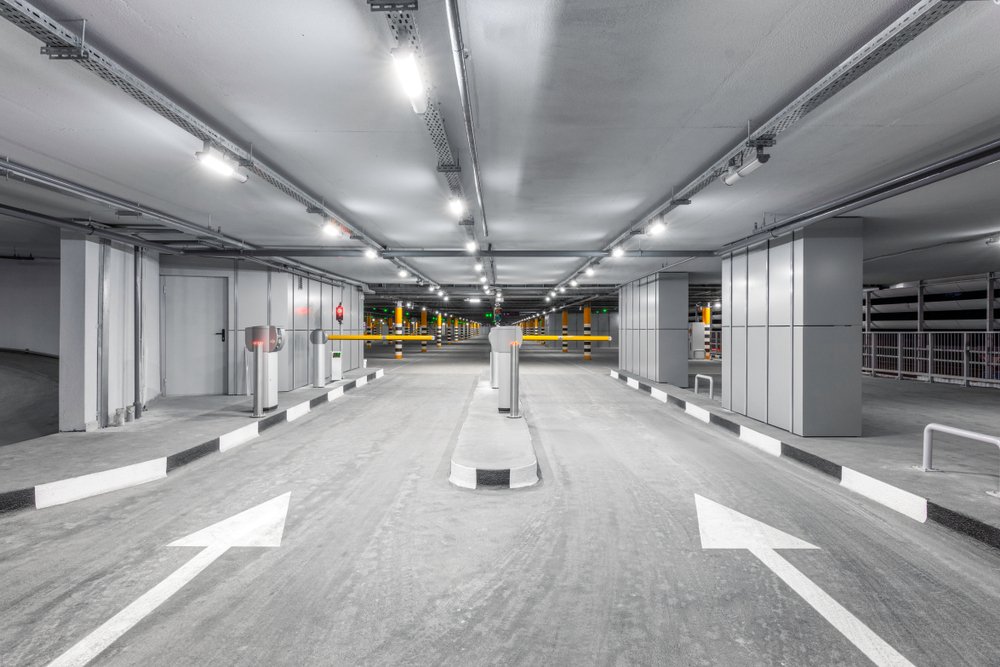
Photo Credit: Anton Marynenko / Shutterstock
13. Parking lots & garages
- Percentage change in spending since January 2020: +4.8%
- Total change in spending since January 2020: +$69,000,000
- Total spending (current): $1,500,000,000
- Total spending (January 2020): $1,431,000,000
- Description: Commercial parking lots and parking garages.

Photo Credit: Ysbrand Cosijn / Shutterstock
12. Galleries & museums
- Percentage change in spending since January 2020: +5.9%
- Total change in spending since January 2020: +$93,000,000
- Total spending (current): $1,678,000,000
- Total spending (January 2020): $1,585,000,000
- Description: Art galleries, cultural centers, and museums.
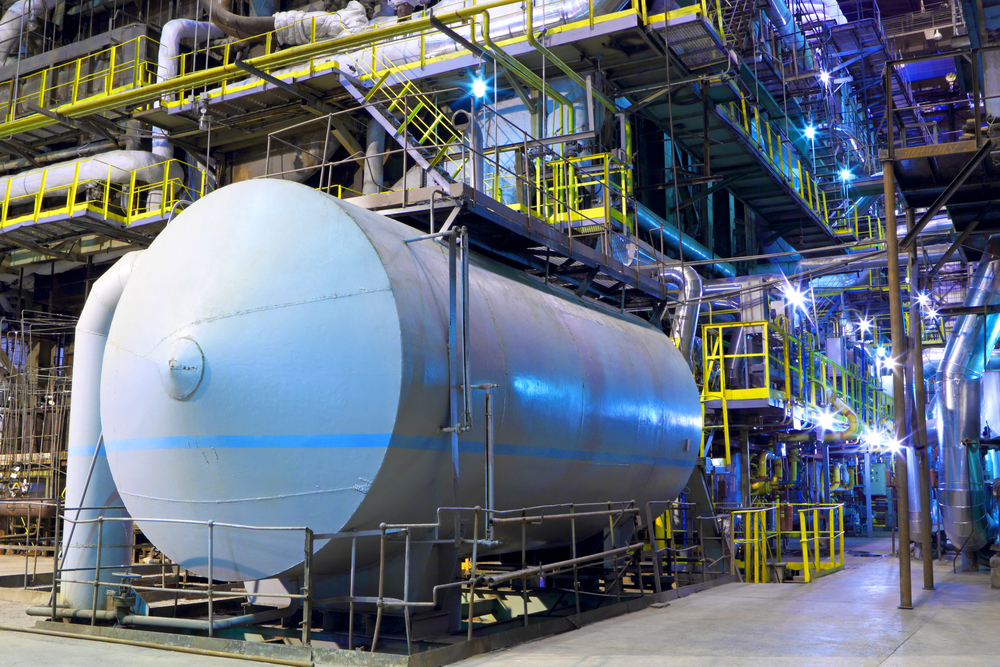
Photo Credit: hramovnick / Shutterstock
11. Chemical manufacturing
- Percentage change in spending since January 2020: +6.7%
- Total change in spending since January 2020: +$1,931,000,000
- Total spending (current): $30,645,000,000
- Total spending (January 2020): $28,714,000,000
- Description: Chemical industries transform organic and inorganic raw materials by a chemical process and form products.

Photo Credit: Supermop / Shutterstock
10. Social centers & clubs
- Percentage change in spending since January 2020: +8.9%
- Total change in spending since January 2020: +$152,000,000
- Total spending (current): $1,851,000,000
- Total spending (January 2020): $1,699,000,000
- Description: Neighborhood centers, banquet halls, lodge buildings, golf courses, community houses, community centers, fraternal halls, and country clubs.
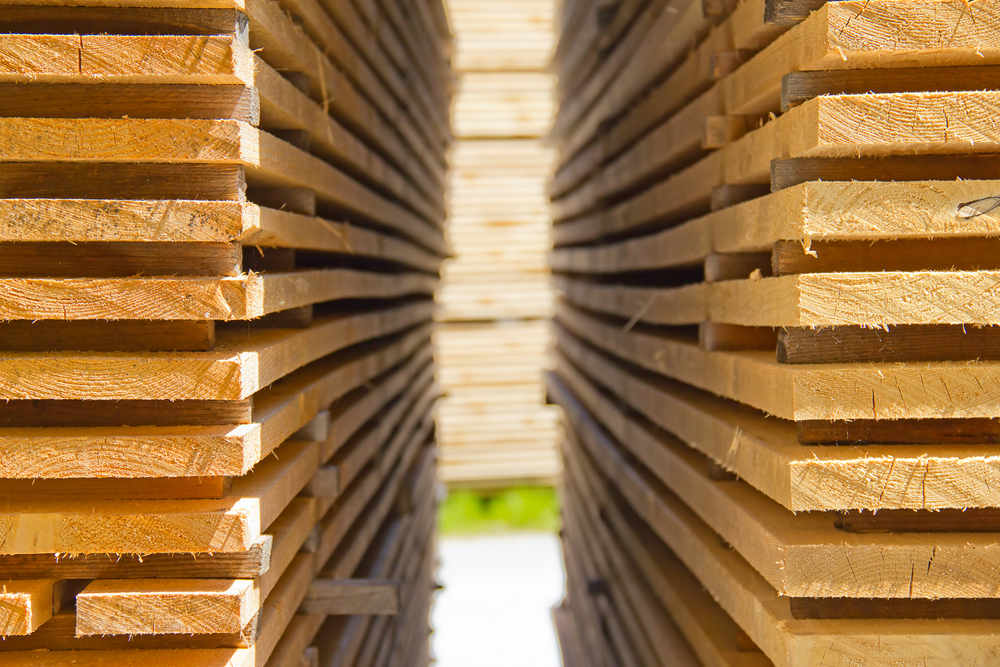
Photo Credit: Natali Glado / Shutterstock
9. Building supply stores
- Percentage change in spending since January 2020: +13.0%
- Total change in spending since January 2020: +$122,000,000
- Total spending (current): $1,063,000,000
- Total spending (January 2020): $941,000,000
- Description: Hardware stores and lumber yards.
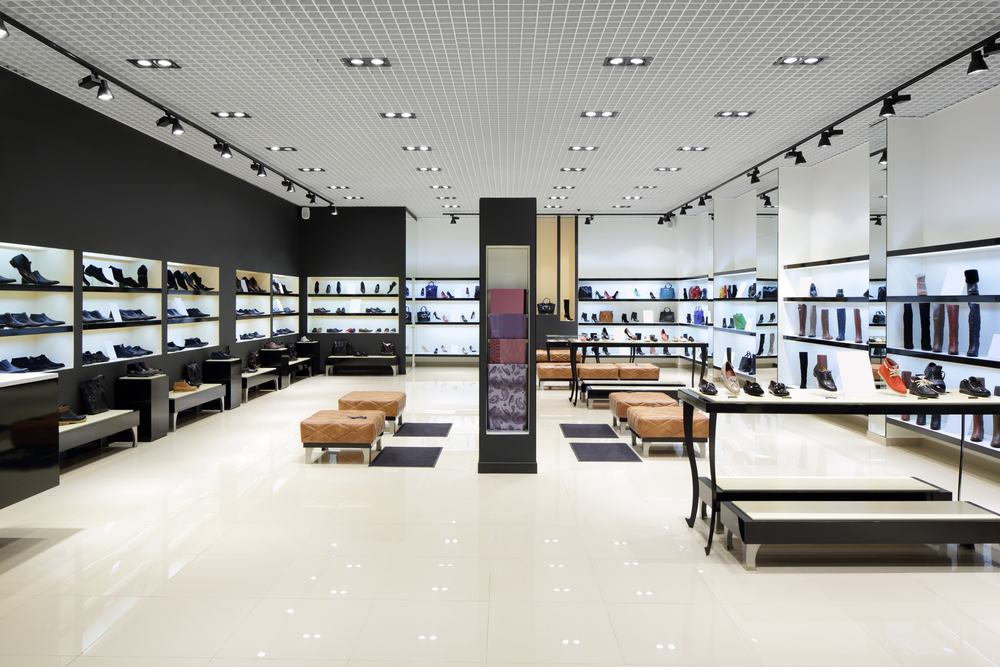
Photo Credit: fiphoto / Shutterstock
8. General merchandise retail stores
- Percentage change in spending since January 2020: +22.1%
- Total change in spending since January 2020: +$486,000,000
- Total spending (current): $2,681,000,000
- Total spending (January 2020): $2,195,000,000
- Description: Department stores and variety stores.
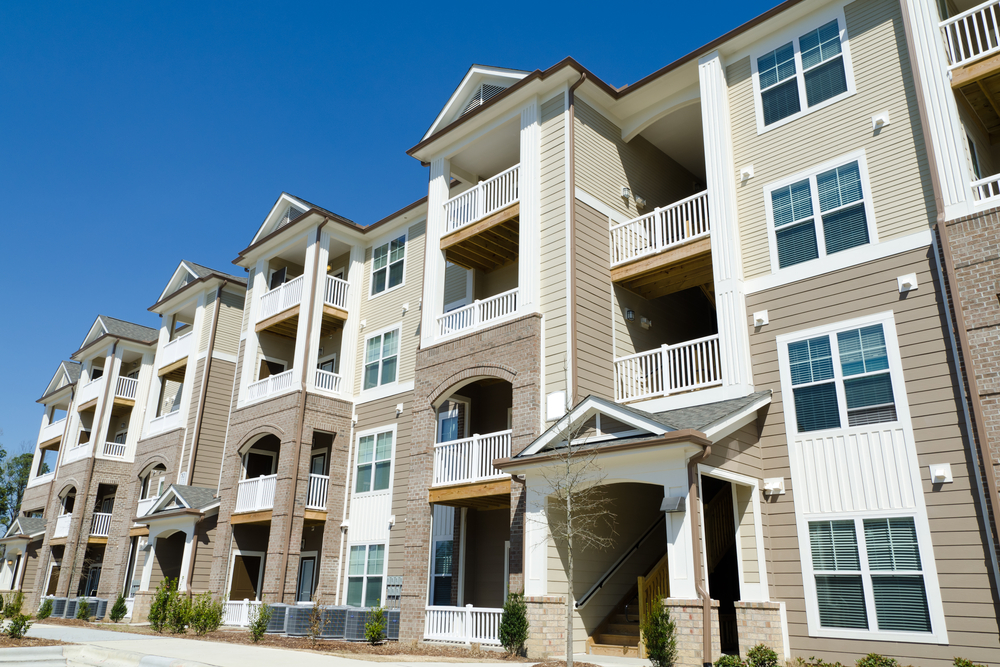
Photo Credit: Konstantin L / Shutterstock
7. New multifamily residential
- Percentage change in spending since January 2020: +23.4%
- Total change in spending since January 2020: +$18,972,000,000
- Total spending (current): $99,999,000,000
- Total spending (January 2020): $81,027,000,000
- Description: New apartments and condominiums, excluding residential units in buildings that are primarily nonresidential.
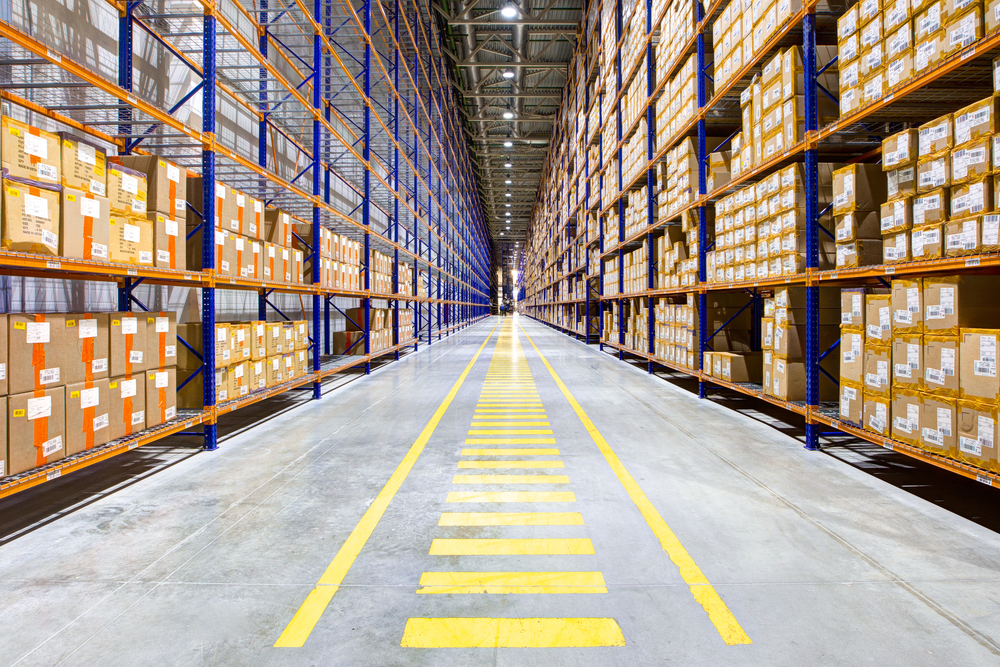
Photo Credit: Petinov Sergey Mihilovich / Shutterstock
6. Commercial warehouses
- Percentage change in spending since January 2020: +27.5%
- Total change in spending since January 2020: +$10,024,000,000
- Total spending (current): $46,510,000,000
- Total spending (January 2020): $36,486,000,000
- Description: Commercial warehouses, storage warehouses, and distribution buildings.
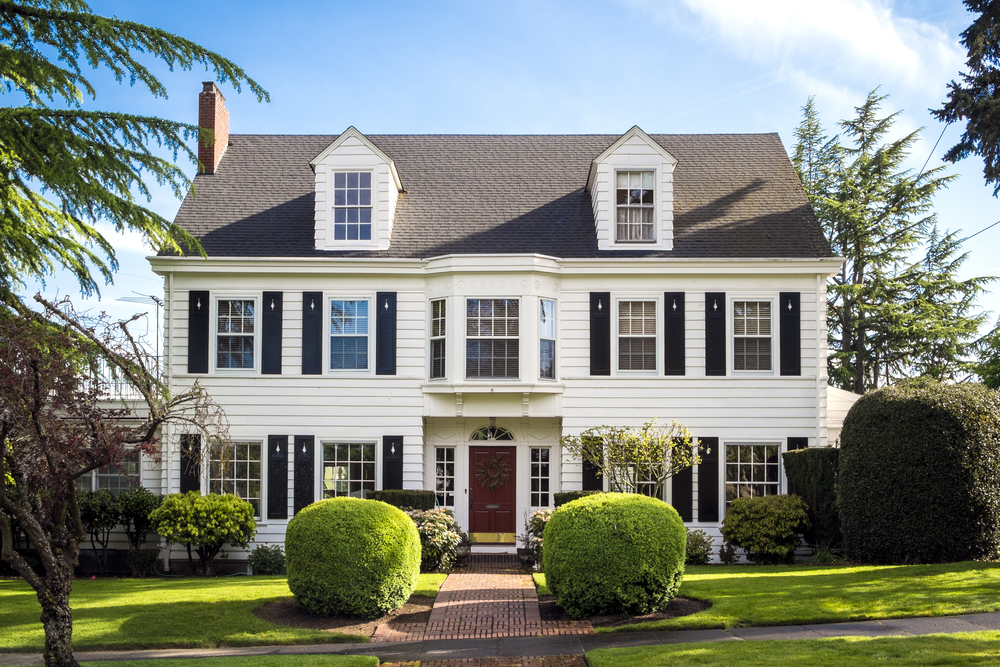
Photo Credit: Robert Crum / Shutterstock
5. New single family residential
- Percentage change in spending since January 2020: +40.8%
- Total change in spending since January 2020: +$122,075,000,000
- Total spending (current): $421,048,000,000
- Total spending (January 2020): $298,973,000,000
- Description: New houses and townhouses built to be sold or rented and units built by the owner or for the owner on contract; excludes residential units in buildings that are primarily nonresidential, manufactured housing, and houseboats.

Photo Credit: asharkyu / Shutterstock
4. Computer, electronic & electrical manufacturing
- Percentage change in spending since January 2020: +42.8%
- Total change in spending since January 2020: +$4,049,000,000
- Total spending (current): $13,507,000,000
- Total spending (January 2020): $9,458,000,000
- Description: Computers, computer peripherals and similar electronic products, products that generate and distribute electrical power, electric lighting equipment, household appliances, and other electrical equipment and components.

Photo Credit: Nordroden / Shutterstock
3. Food, beverage & tobacco manufacturing
- Percentage change in spending since January 2020: +47.5%
- Total change in spending since January 2020: +$3,377,000,000
- Total spending (current): $10,480,000,000
- Total spending (January 2020): $7,103,000,000
- Description: All food and beverage products for intermediate or final consumption, as well as tobacco and tobacco products.
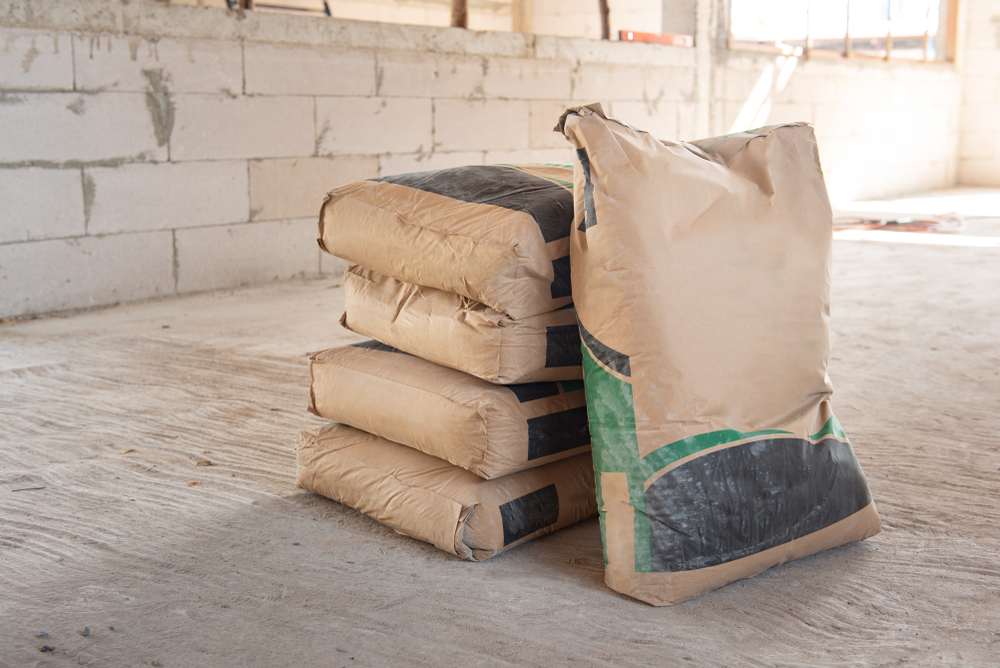
Photo Credit: MK photograp55 / Shutterstock
2. Nonmetallic mineral manufacturing
- Percentage change in spending since January 2020: +59.5%
- Total change in spending since January 2020: +$505,000,000
- Total spending (current): $1,354,000,000
- Total spending (January 2020): $849,000,000
- Description: Nonmetallic mineral industries transform mined or quarried nonmetallic minerals, such as sand, gravel, stone, clay, and refractory materials, into products for intermediate or final consumption.
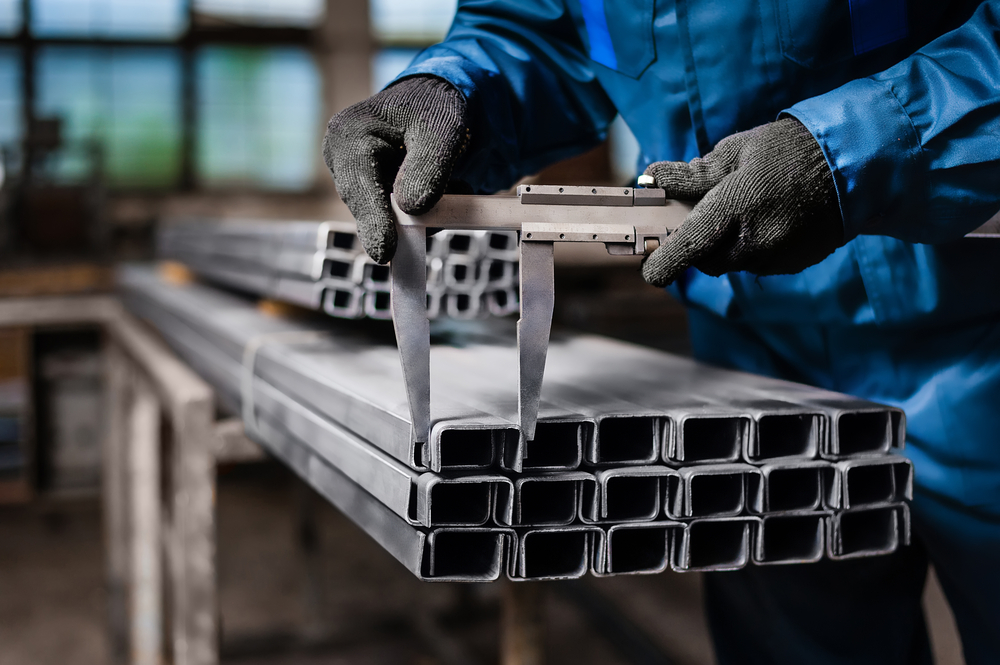
Photo Credit: flywish / Shutterstock
1. Fabricated metal manufacturing
- Percentage change in spending since January 2020: +72.6%
- Total change in spending since January 2020: +$942,000,000
- Total spending (current): $2,239,000,000
- Total spending (January 2020): $1,297,000,000
- Description: Fabricated metal industries transform metal into intermediate or end products, excluding machinery, computers, electronics, and metal furniture.
Methodology & Detailed Findings
The data used in this analysis is from the U.S. Census Bureau’s Value of Construction Put in Place Survey, which provides monthly estimates of the total dollar value of construction work done in the U.S. To identify the sectors with the biggest increase in spending since COVID-19 started, researchers calculated the percentage change in spending (seasonally-adjusted annual rate) between January 2020 and November of 2021. Researchers also included the total change in spending on an annualized basis. More complete descriptions of the sectors included in this study can be found here.