Cities With the Sharpest Drop in Construction Activity Amid COVID-19
When the coronavirus pandemic upended the U.S. economy, many states halted or limited construction work. While real estate development is beginning to resume, recently released data from the U.S. Census Bureau showed an unprecedented drop in residential building permits comparing April of this year to April of 2019. Nationally, there was a 20 percent decline in new housing units authorized by building permits, a drop that represents nearly $4.4 billion in value.
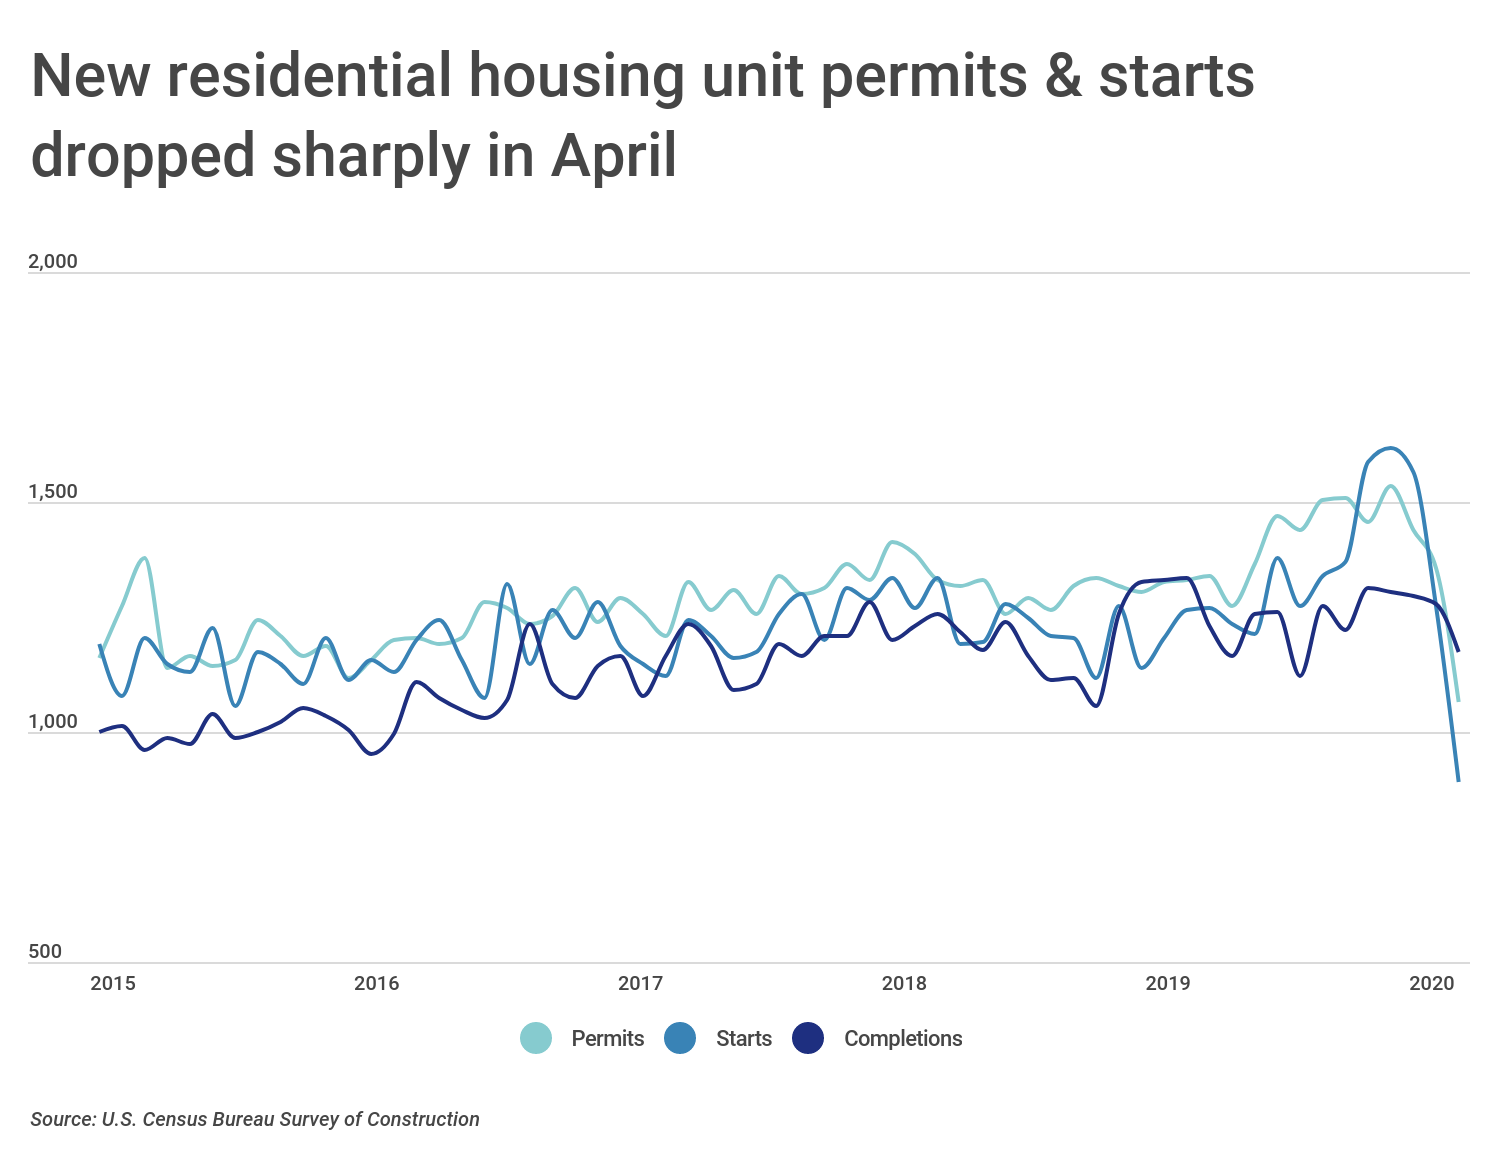
According to the New Residential Construction Report, COVID-19 negatively affected all stages of housing construction, but new building permit authorizations and housing starts fell further than completions of existing projects. At the national level, both new building permits and housing starts decreased to their lowest levels in half a decade.
A dramatic decline in new housing unit authorizations now indicates that there will be a prolonged slowdown in new home construction in the coming months—the average time between permit issue and the start of construction is about 1-2 months. It remains uncertain how long it will take new housing authorizations to reach their pre-COVID levels.
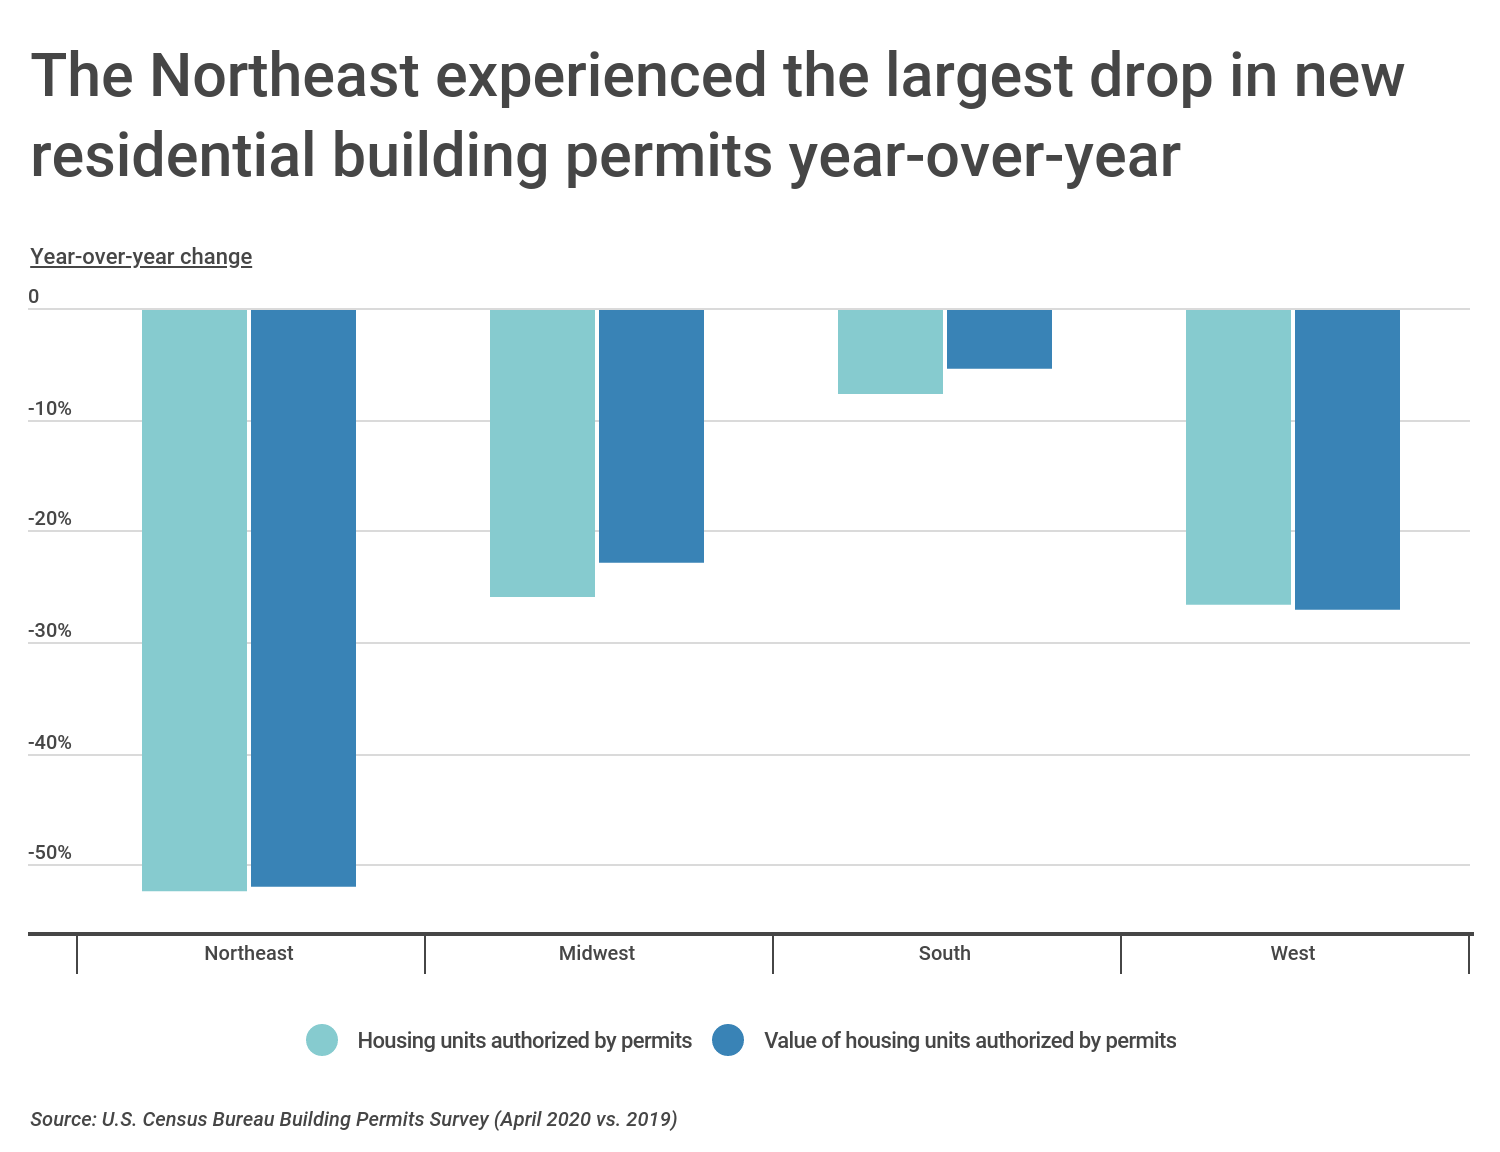
While the construction industry has been hit hard nationally, certain parts of the country have been impacted more than others. The Northeast is experiencing the sharpest drop in residential construction, with a 52.2 percent decline in permits and a 51.8 percent decline in the estimated value represented by those permits comparing April 2020 to April 2019. Construction in the South, on the other hand, only dropped slightly. New housing units authorized by building permits in the South decreased 7.6 percent year-over-year, with a drop in value of only 5.3 percent.
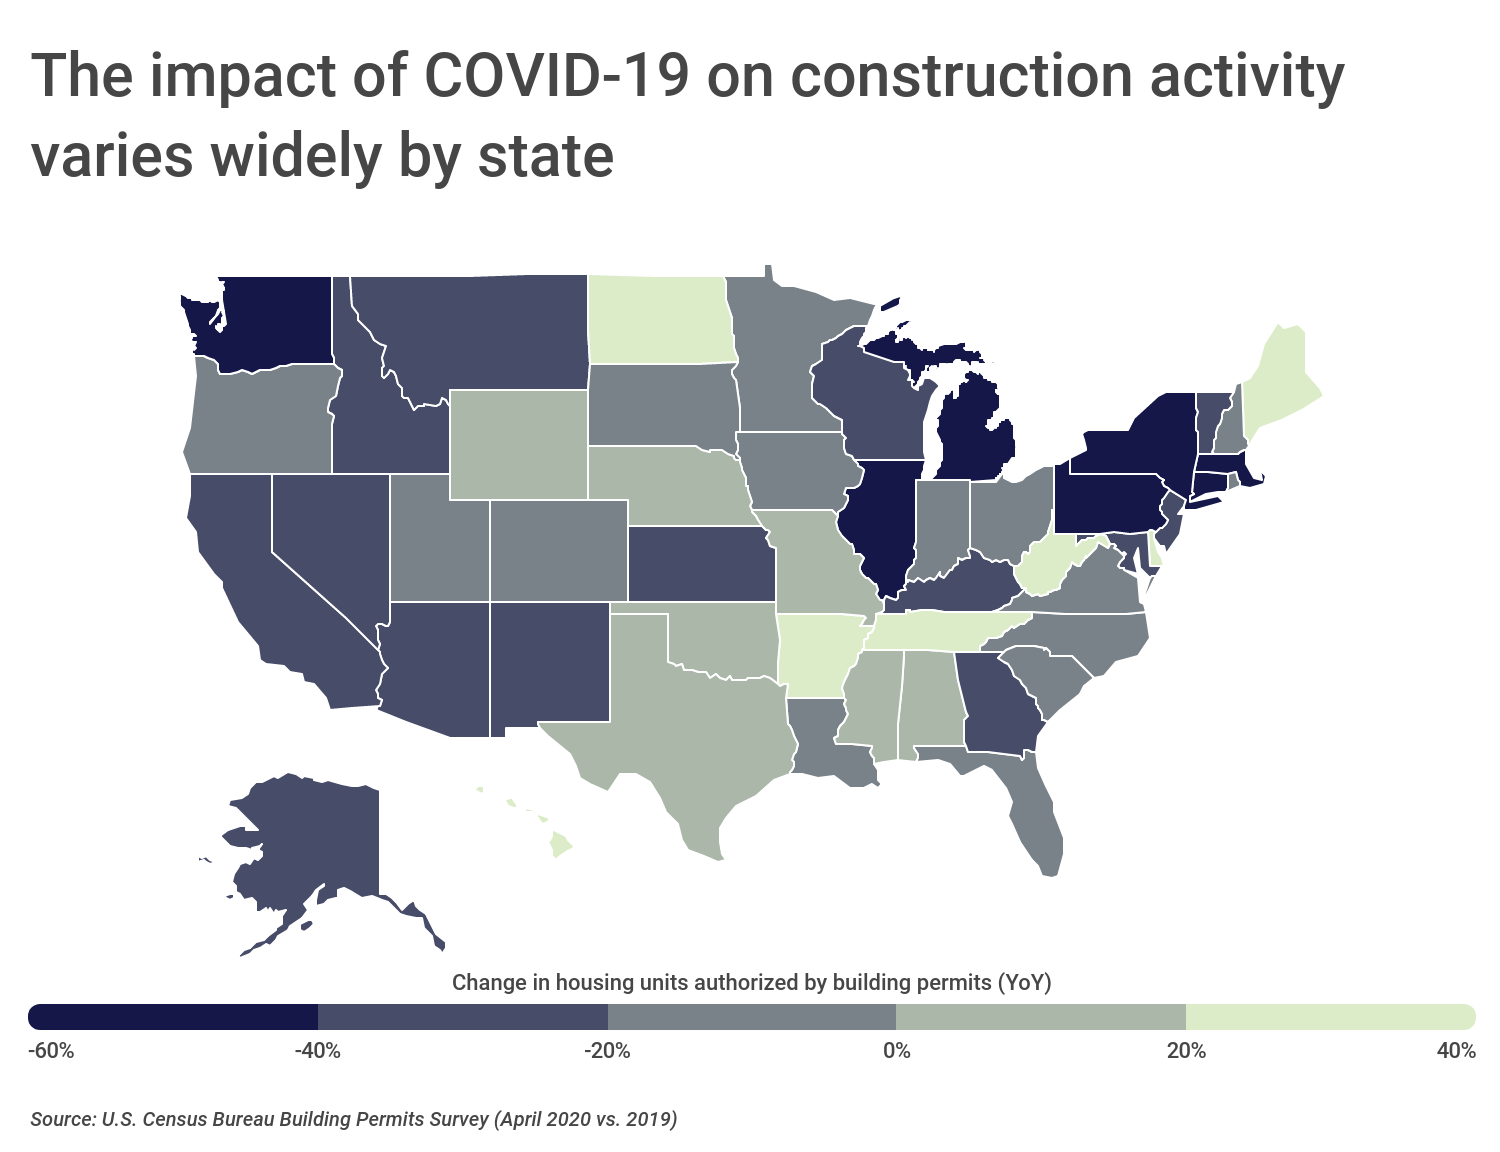
At the state level, New York experienced the sharpest drop in residential building permits year-over-year, at 71.3 percent. Construction in Michigan, Pennsylvania, and Illinois was also hit particularly hard. On the other hand, 14 states actually saw an increase in the number of new housing units authorized by building permits over the same time period. Many of these states, like Alabama, Arkansas, Maine, Mississippi, North Dakota, and West Virginia are Southern or have large rural populations.
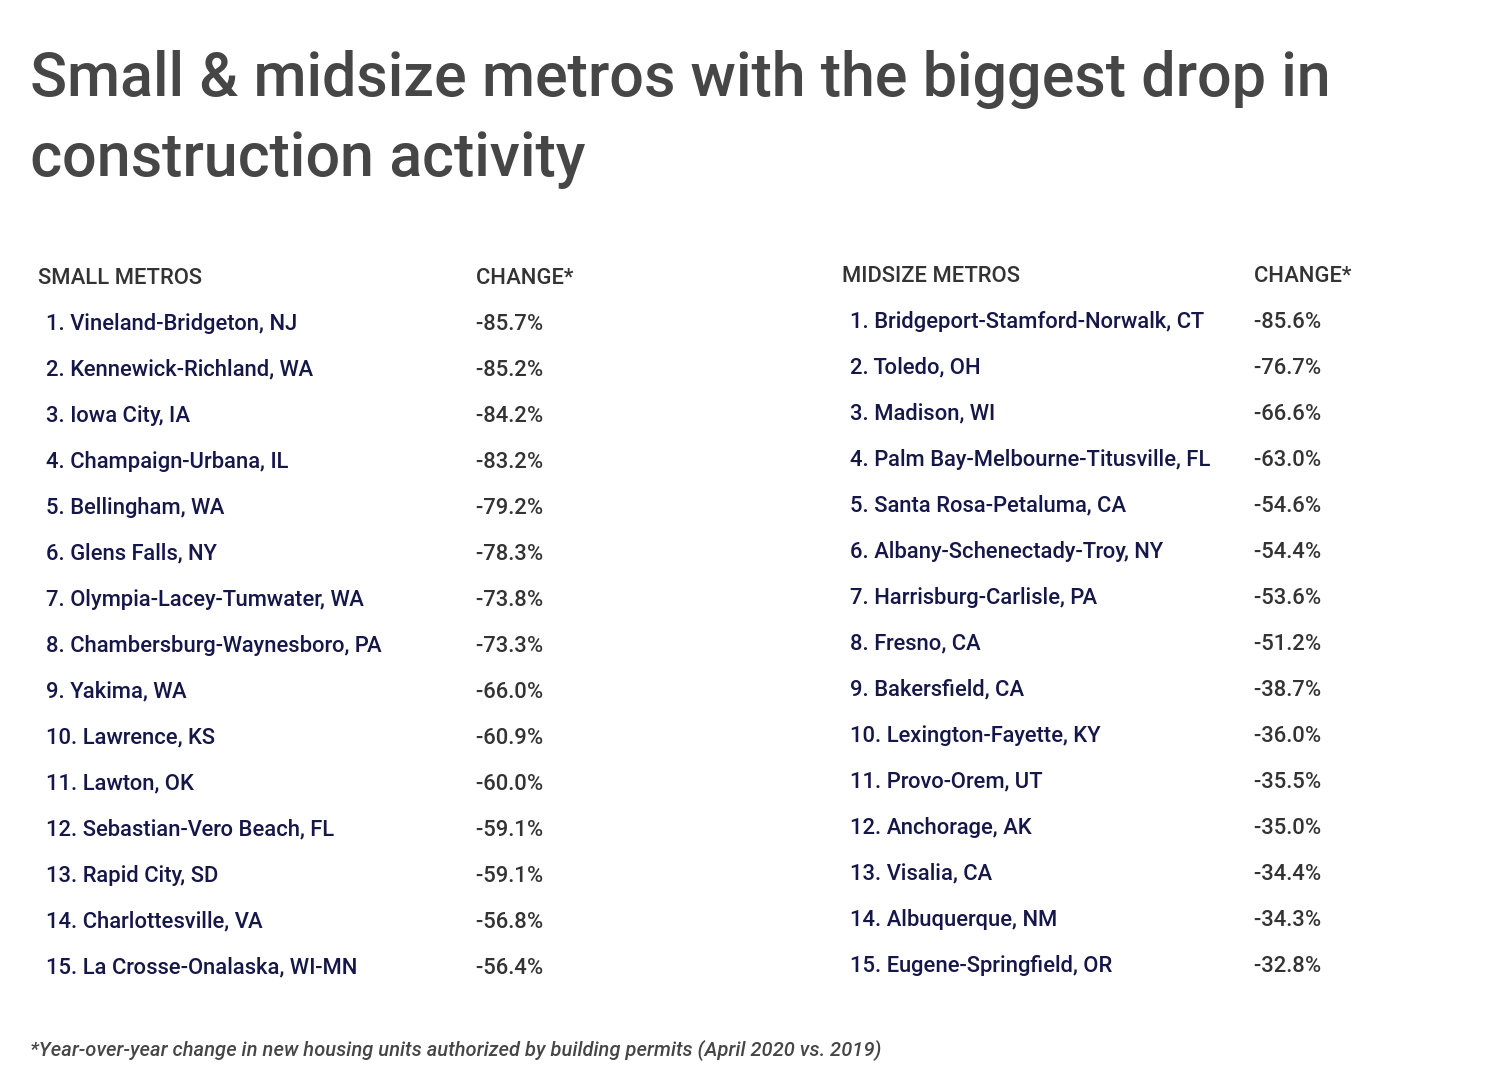
At the local level, certain communities suffered even more dramatic changes in building permits. To find which individual metropolitan areas are experiencing the biggest drop in new home construction, researchers at Construction Coverage, a review website for construction project management software and commercial truck insurance, analyzed data from the U.S. Census Bureau Building Permits Survey. They compared the number of new housing units authorized by building permits in April 2020 and April 2019. This year-over-year percentage change in permits was used to calculate the rankings. Metros were grouped into cohorts based on population size: large metros (1,000,000 residents or more), midsize metros (350,000-999,999 residents), and small metros (less than 350,000 residents).
A majority of the metros below are located on or near the coasts. Here are the metros with the largest drop in new residential construction.
Large Metros With the Biggest Drop in Construction

15. Baltimore-Columbia-Towson, MD
- Change in new residential units authorized by building permits: -42.9%
- Units authorized in April 2020: 443
- Units authorized in April 2019: 776
- Change in value: -$87,625,000
FOR CONSTRUCTION PROFESSIONALS
Before starting your next construction project, make sure to have a solid builders risk insurance policy, as well as workers’ compensation insurance. These policies protect your business and your employees should something go wrong.

14. San Jose-Sunnyvale-Santa Clara, CA
- Change in new residential units authorized by building permits: -44.4%
- Units authorized in April 2020: 296
- Units authorized in April 2019: 532
- Change in value: -$72,236,000

13. Riverside-San Bernardino-Ontario, CA
- Change in new residential units authorized by building permits: -45.1%
- Units authorized in April 2020: 745
- Units authorized in April 2019: 1,356
- Change in value: -$158,676,000

12. Miami-Fort Lauderdale-Pompano Beach, FL
- Change in new residential units authorized by building permits: -45.1%
- Units authorized in April 2020: 1,466
- Units authorized in April 2019: 2,671
- Change in value: -$313,312,000

11. Seattle-Tacoma-Bellevue, WA
- Change in new residential units authorized by building permits: -46.6%
- Units authorized in April 2020: 1,622
- Units authorized in April 2019: 3,036
- Change in value: -$238,679,000
TRENDING ON CONSTRUCTION COVERAGE
Thinking about upgrading your vehicles? Be sure to find the best commercial auto insurance policy for your business.

10. Hartford-East Hartford-Middletown, CT
- Change in new residential units authorized by building permits: -48.4%
- Units authorized in April 2020: 63
- Units authorized in April 2019: 122
- Change in value: -$6,758,000

9. Milwaukee-Waukesha, WI
- Change in new residential units authorized by building permits: -51.6%
- Units authorized in April 2020: 168
- Units authorized in April 2019: 347
- Change in value: -$17,069,000

8. Philadelphia-Camden-Wilmington, PA-NJ-DE-MD
- Change in new residential units authorized by building permits: -53.0%
- Units authorized in April 2020: 682
- Units authorized in April 2019: 1,450
- Change in value: -$97,698,000

7. Chicago-Naperville-Elgin, IL-IN-WI
- Change in new residential units authorized by building permits: -54.0%
- Units authorized in April 2020: 1,077
- Units authorized in April 2019: 2,343
- Change in value: -$177,865,000

6. Sacramento-Roseville-Folsom, CA
- Change in new residential units authorized by building permits: -56.4%
- Units authorized in April 2020: 363
- Units authorized in April 2019: 833
- Change in value: -$117,829,000

5. New York-Newark-Jersey City, NY-NJ-PA
- Change in new residential units authorized by building permits: -59.0%
- Units authorized in April 2020: 1,571
- Units authorized in April 2019: 3,830
- Change in value: -$394,859,000

4. Buffalo-Cheektowaga, NY
- Change in new residential units authorized by building permits: -61.3%
- Units authorized in April 2020: 48
- Units authorized in April 2019: 124
- Change in value: -$17,884,000

3. Louisville-Jefferson County, KY-IN
- Change in new residential units authorized by building permits: -64.3%
- Units authorized in April 2020: 232
- Units authorized in April 2019: 650
- Change in value: -$39,518,000

2. Detroit-Warren-Dearborn, MI
- Change in new residential units authorized by building permits: -70.6%
- Units authorized in April 2020: 210
- Units authorized in April 2019: 714
- Change in value: -$127,488,000

1. Rochester, NY
- Change in new residential units authorized by building permits: -84.1%
- Units authorized in April 2020: 45
- Units authorized in April 2019: 283
- Change in value: -$42,364,000
Methodology & Full Results
While the drop in new home construction coincided with the pandemic, there is only a weak negative correlation between the number of COVID-19 cases per capita and the drop in construction in each state. For example, New York experienced the sharpest drop in construction of all states (71.3 percent) and also has the highest rate of COVID-19 cases per capita (1,869 cases per 100,000 residents as of May 31, 2020). On the other hand, Washington state also had one of the largest drops in construction (46.5 percent), but its rate of 280 cases per 100,000 residents is lower than the national average of 469 cases per 100,000 residents (also as of May 31, 2020). The differences in construction activity by state highlight differences in state COVID-19 responses, which are not well-correlated with infection rates.
Monthly statistics on new housing units and new housing unit values are from the U.S. Census Bureau Building Permits Survey. The survey includes new single- and multi-unit housing projects authorized by building permits at the metropolitan, state, and national levels.
For each metropolitan area, Construction Coverage calculated the percentage change in the number of new housing units authorized in April 2020 compared to April 2019. This statistic was used to rank the metros. In the event of a tie, the location with the larger percentage change in value was ranked higher.
Some building permit offices only report data to the Census Bureau annually, rather than monthly. As a result, the monthly data for certain metropolitan areas only includes a subset of total permits issued. To improve the accuracy of this analysis, only metropolitan areas in which at least 70 percent of its total building permits are accounted for by offices that report monthly were included in the analysis. Additionally, metropolitan areas with fewer than 100,000 residents were excluded.
The Census Bureau defines a housing unit to be: “a house, an apartment, a group of rooms, or a single room intended for occupancy as separate living quarters. Separate living quarters are those in which the occupants live separately from any other individuals in the building and which have direct access from the outside of the building or through a common hall.” Per this definition, each apartment unit in an apartment building is counted as one housing unit. Housing unit statistics do not include dormitories, hotels, or nursing homes.