
Industries With the Highest Rates of Workplace Injuries
One of the concepts that the COVID-19 pandemic brought to the forefront of the public imagination is the idea of an “essential worker.” The pandemic highlighted that many professions are critical for allowing the rest of the economy and society to function properly, especially in a time of crisis. Some essential professionals like health workers and teachers were already held in high regard, but COVID-19 put a new spotlight on workers in oft-overlooked industries like grocery, elder care, and shipping and logistics.
Of course, the reason why these professions have drawn attention is the fact that workers in these fields kept working despite higher risks of virus exposure in the course of doing their jobs. Early on in the pandemic, many people were easily able to transition to working remotely, while many others saw their jobs eliminated or hours reduced as a result of COVID-19’s economic shocks. But essential workers mostly continued working in-person, all the while confronting the greater possibility of contracting COVID-19.
These varying experiences of COVID-19 across professions reflect the larger fact that every job has different levels and types of risk inherent in the work. Professions that involve manual labor or interacting with tools and machinery tend to be among the most prone to injury and illness, but no job is perfectly safe. Fortunately, however, the U.S. has seen positive trends in reducing the number and severity of work-related injuries and illnesses in recent years.
RELATED
No matter what industry you are in, it’s important (and usually required) to have workers’ compensation insurance. A good workers’ comp policy provides wage replacement and medical benefits to employees if they are injured at work.
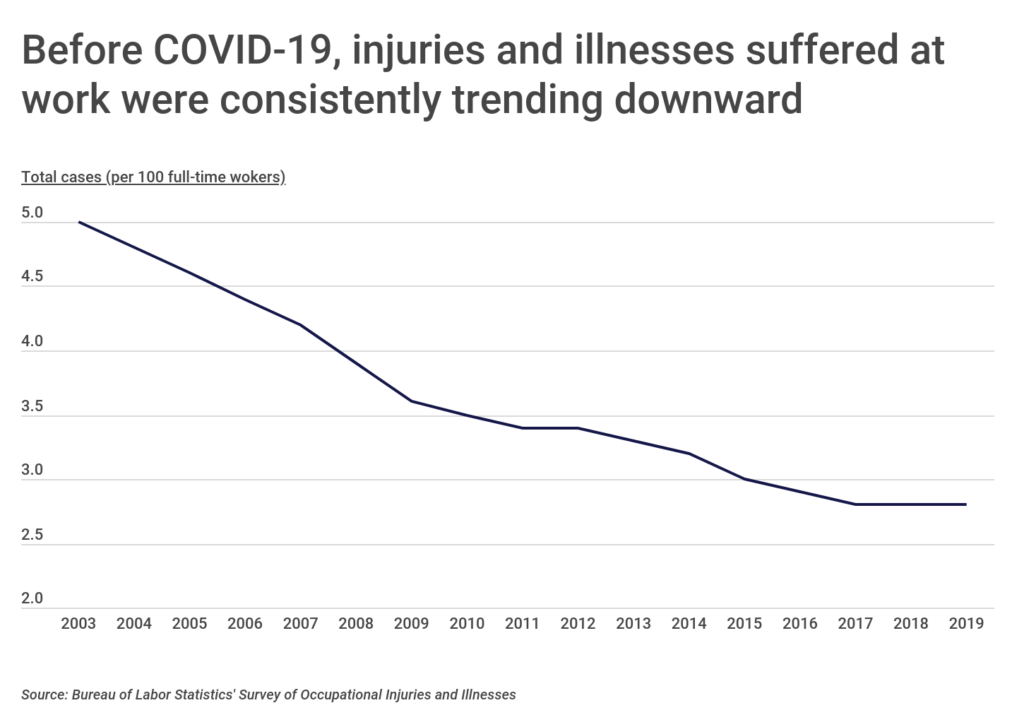
According to data from the Bureau of Labor Statistics, the overall number of cases per 100 full-time workers has been cut nearly in half over the last two decades, from 5.0 in 2003 to 2.8 in 2019. And this is part of a much longer-running trend that began with the creation of the Occupational Safety and Health Administration in the early 1970s. When OSHA was created in 1971, the rate of injury and illness on the job was 11 per 100 workers, but that number has been on the decline ever since thanks to OSHA and other efforts to promote workplace safety.
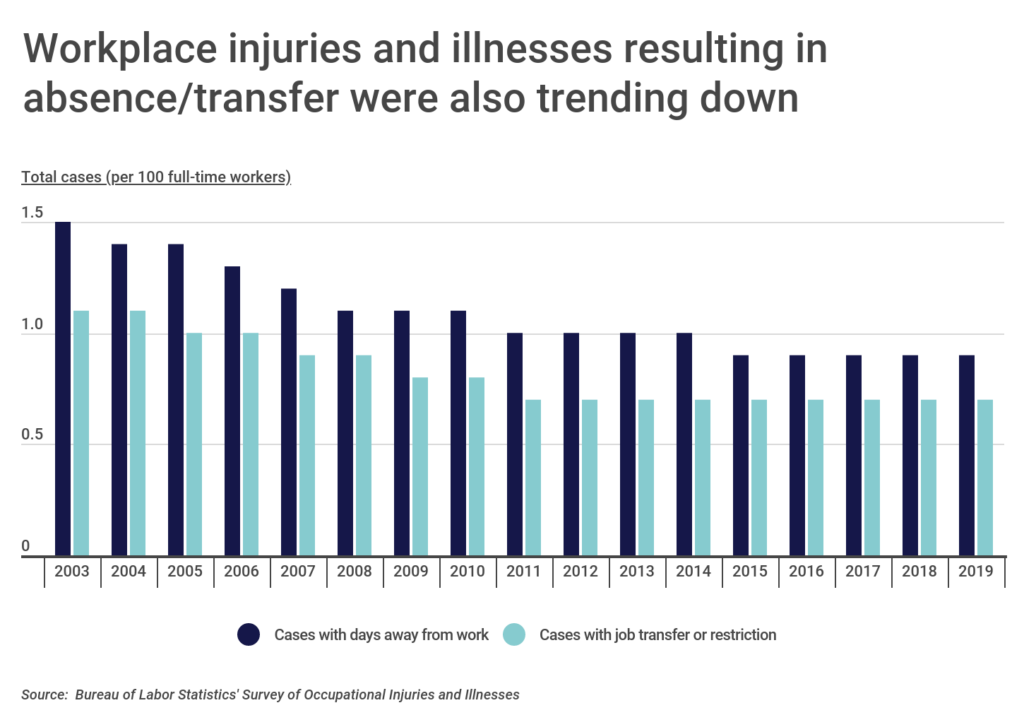
Lower incidences of workplace injury and illness overall have come with a parallel reduction in the number of injuries and illnesses that inhibit the ability to work. In 2003, there were 1.5 cases per 100 workers that led to days away from work. That number dipped to 1.0 in 2011 and has remained at or below that level ever since.
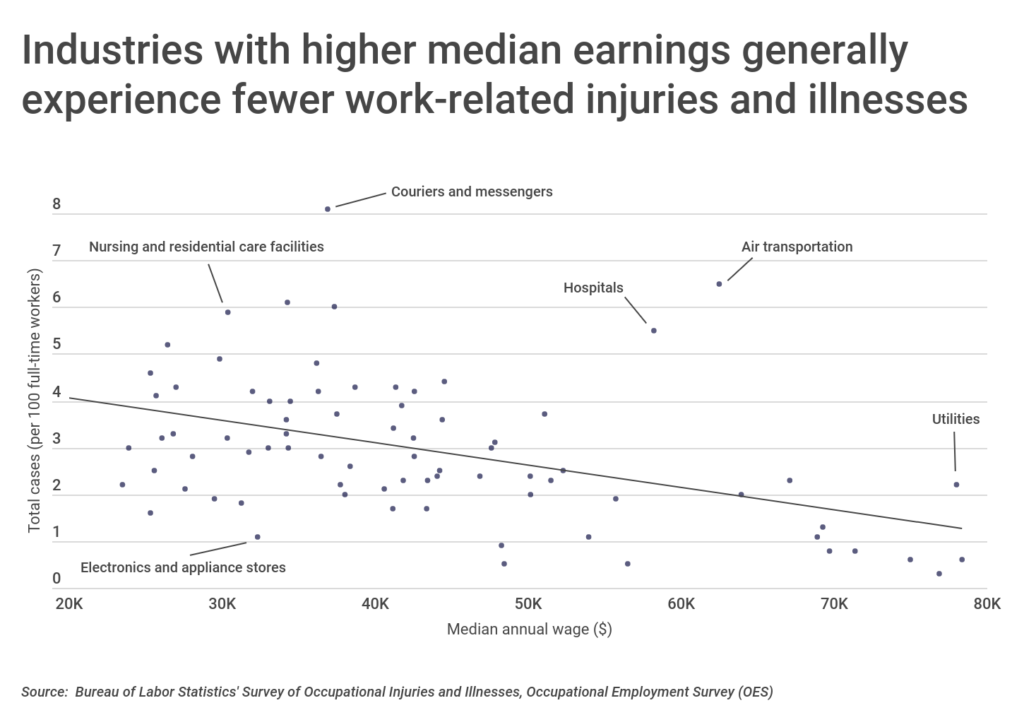
Despite this progress overall, the risk profile across professions continues to vary, and the data suggest that these different risk levels are also closely correlated with income. In general, industries with lower median earnings tend to see more work-related illnesses or injuries, while industries with higher earnings tend to see fewer. This situation is likely to be exacerbated by COVID-19, as many essential professions or other jobs that have continued in-person also pay lower wages than the lower-risk white-collar jobs that were able to transition to virtual work.
To identify the industries with the highest rates of workplace injuries, researchers at Construction Coverage collected data from the Bureau of Labor Statistics, including each industry’s total number of cases per 100 workers, cases resulting in missed days or job transfer/restrictions, median wage, and total employment. Industries were ranked by the total number of cases per 100 workers.
Here are the industries with the highest rates of workplace injuries.
Industries With the Highest Rates of Workplace Injuries

Photo Credit: Alamy Stock Photo
15. Beverage and Tobacco Product Manufacturing
- Total cases (per 100 workers): 4.3
- Cases with days away from work (per 100 workers): 1.3
- Cases with days of job transfer/restriction (per 100 workers): 1.6
- Other cases (per 100 workers): 1.4
- Median annual wage: $38,680
- Total employment: 282,110

Photo Credit: Alamy Stock Photo
14. Primary Metal Manufacturing
- Total cases (per 100 workers): 4.4
- Cases with days away from work (per 100 workers): 1.2
- Cases with days of job transfer/restriction (per 100 workers): 1.5
- Other cases (per 100 workers): 1.7
- Median annual wage: $44,520
- Total employment: 385,910

Photo Credit: Alamy Stock Photo
13. Fishing, Hunting and Trapping
- Total cases (per 100 workers): 4.6
- Cases with days away from work (per 100 workers): 2.3
- Cases with days of job transfer/restriction (per 100 workers): N/A
- Other cases (per 100 workers): 1.5
- Median annual wage: N/A
- Total employment: N/A
Photo Credit: Alamy Stock Photo
12. General Merchandise Stores
- Total cases (per 100 workers): 4.6
- Cases with days away from work (per 100 workers): 1.2
- Cases with days of job transfer/restriction (per 100 workers): 1.6
- Other cases (per 100 workers): 1.8
- Median annual wage: $25,310
- Total employment: 3,129,540

Photo Credit: Alamy Stock Photo
11. Warehousing and Storage
- Total cases (per 100 workers): 4.8
- Cases with days away from work (per 100 workers): 1.9
- Cases with days of job transfer/restriction (per 100 workers): 1.7
- Other cases (per 100 workers): 1.2
- Median annual wage: $36,170
- Total employment: 1,214,230

Photo Credit: Alamy Stock Photo
10. Building Material and Garden Equipment and Supplies Dealers
- Total cases (per 100 workers): 4.9
- Cases with days away from work (per 100 workers): 1.6
- Cases with days of job transfer/restriction (per 100 workers): 1.7
- Other cases (per 100 workers): 1.6
- Median annual wage: $29,830
- Total employment: 1,311,670

Photo Credit: Alamy Stock Photo
9. Support Activities for Agriculture and Forestry
- Total cases (per 100 workers): 5.2
- Cases with days away from work (per 100 workers): 1.8
- Cases with days of job transfer/restriction (per 100 workers): 1.5
- Other cases (per 100 workers): 1.9
- Median annual wage: $26,430
- Total employment: 382,330

Photo Credit: Alamy Stock Photo
8. Crop Production
- Total cases (per 100 workers): 5.3
- Cases with days away from work (per 100 workers): 1.4
- Cases with days of job transfer/restriction (per 100 workers): 1.6
- Other cases (per 100 workers): 2.2
- Median annual wage: N/A
- Total employment: N/A

Photo Credit: Alamy Stock Photo
7. Hospitals
- Total cases (per 100 workers): 5.5
- Cases with days away from work (per 100 workers): 1.3
- Cases with days of job transfer/restriction (per 100 workers): 0.9
- Other cases (per 100 workers): 3.3
- Median annual wage: $58,210
- Total employment: 6,094,940
RELATED
While workers’ comp insurance protects your employees, commercial property insurance protects your buildings and other physical property. Consider a policy with one of our top-rated commercial property insurance companies.
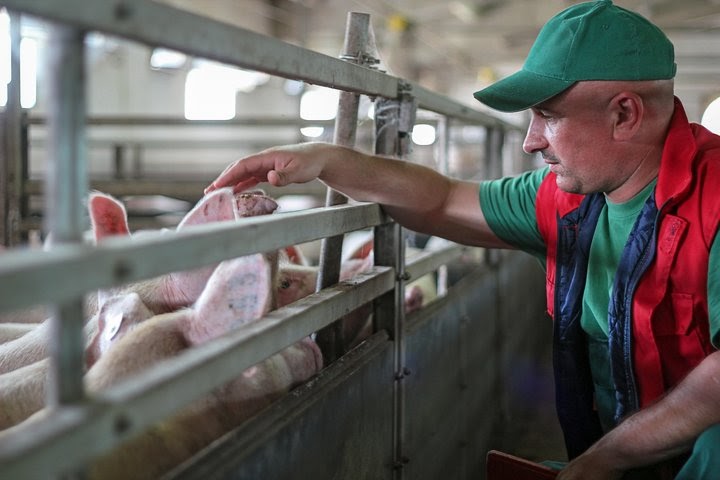
Photo Credit: Alamy Stock Photo
6. Animal Production and Aquaculture
- Total cases (per 100 workers): 5.6
- Cases with days away from work (per 100 workers): 2.1
- Cases with days of job transfer/restriction (per 100 workers): 1.3
- Other cases (per 100 workers): 2.1
- Median annual wage: N/A
- Total employment: N/A

Photo Credit: Alamy Stock Photo
5. Nursing and Residential Care Facilities
- Total cases (per 100 workers): 5.9
- Cases with days away from work (per 100 workers): 1.7
- Cases with days of job transfer/restriction (per 100 workers): 1.8
- Other cases (per 100 workers): 2.4
- Median annual wage: $30,370
- Total employment: 3,351,090

Photo Credit: Alamy Stock Photo
4. Performing Arts, Spectator Sports, and Related Industries
- Total cases (per 100 workers): 6.0
- Cases with days away from work (per 100 workers): 1.4
- Cases with days of job transfer/restriction (per 100 workers): 1.9
- Other cases (per 100 workers): 2.7
- Median annual wage: $37,330
- Total employment: 519,810

Photo Credit: Alamy Stock Photo
3. Wood Product Manufacturing
- Total cases (per 100 workers): 6.1
- Cases with days away from work (per 100 workers): 1.8
- Cases with days of job transfer/restriction (per 100 workers): 1.7
- Other cases (per 100 workers): 2.6
- Median annual wage: $34,260
- Total employment: 406,100

Photo Credit: Alamy Stock Photo
2. Air Transportation
- Total cases (per 100 workers): 6.5
- Cases with days away from work (per 100 workers): 3.7
- Cases with days of job transfer/restriction (per 100 workers): 1.5
- Other cases (per 100 workers): 1.2
- Median annual wage: $62,480
- Total employment: 498,830

Photo Credit: Alamy Stock Photo
1. Couriers and Messengers
- Total cases (per 100 workers): 8.1
- Cases with days away from work (per 100 workers): 3.3
- Cases with days of job transfer/restriction (per 100 workers): 2.8
- Other cases (per 100 workers): 2.1
- Median annual wage: $36,890
- Total employment: 796,660
Detailed Findings & Methodology
To find the industries with the highest rates of workplace injuries, researchers analyzed data from the Bureau of Labor Statistics’ Survey of Occupational Injuries and Illnesses. Incidence rates represent the number of injuries and illnesses per 100 full-time workers. The analysis is of private industry subsectors only (3-digit NAICS code industry levels). Only industries with sufficient data were included in the analysis. Wage and employment data came from the Bureau of Labor Statistics’ Occupational Employment Survey.