The Hottest Real Estate Markets in the U.S.
Note: This is the most recent release of our Hottest Real Estate Markets study. To see data from prior years, please visit the Full Results section below.
After more than two years of stiff competition and fast-rising prices, the U.S. residential housing market experienced a rapid cooldown throughout the latter half of 2022 and the early months of 2023. Despite recent signs that market conditions could be heating up again, 2023 marked a notably more subdued year for U.S. real estate compared to the preceding years.
After a nearly 50% surge in home prices during the first two years of the pandemic, many buyers now find themselves unable to afford property. Inflation in other sectors has made it more difficult to build up the savings needed to buy a home. On top of this, higher interest rates have increased borrowing costs, limiting budgets for many buyers—especially first-time buyers without existing equity or sizable down payments. These combined factors significantly decelerated market activity.
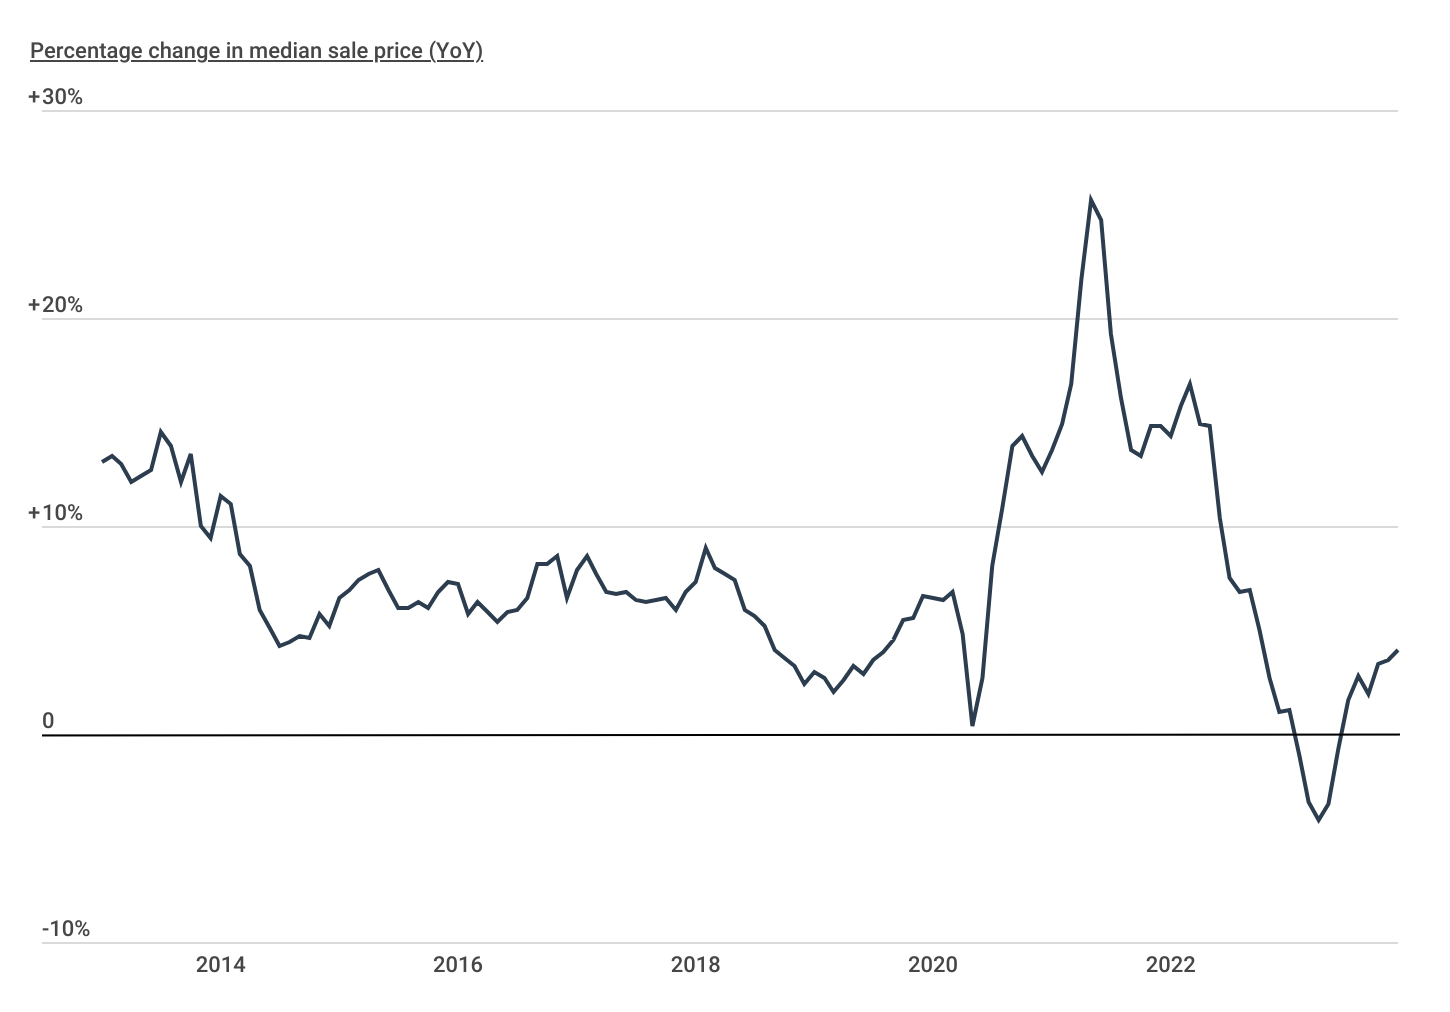
Home Sale Price Changes Over Time
Despite a high mortgage interest rate environment, home sale prices are showing signs of rebounding

RELATED
Are you planning a home renovation soon? A standard homeowners insurance policy won’t cover your home while it’s being renovated, so you might want to consider builders risk insurance for homeowners—designed specifically for the home while under construction or renovation.
One of the most obvious signs of changing market conditions is home price growth. Price growth exploded during the COVID-19 pandemic while interest rates were low, household savings and investment returns were high, and more people were spending time at home. According to data from Redfin, year-over-year growth reached a peak of 25.7% in May 2021, and maintained double-digit percentages until mid-2022. However, by the close of 2022, home prices had only increased by 1.1% from the previous year, and by April 2023, they had declined by 4.1%. Since hitting that low point, annual home price growth has rebounded, and as of December 2023, the median home sale price nationally was 4.0% higher than the year prior.
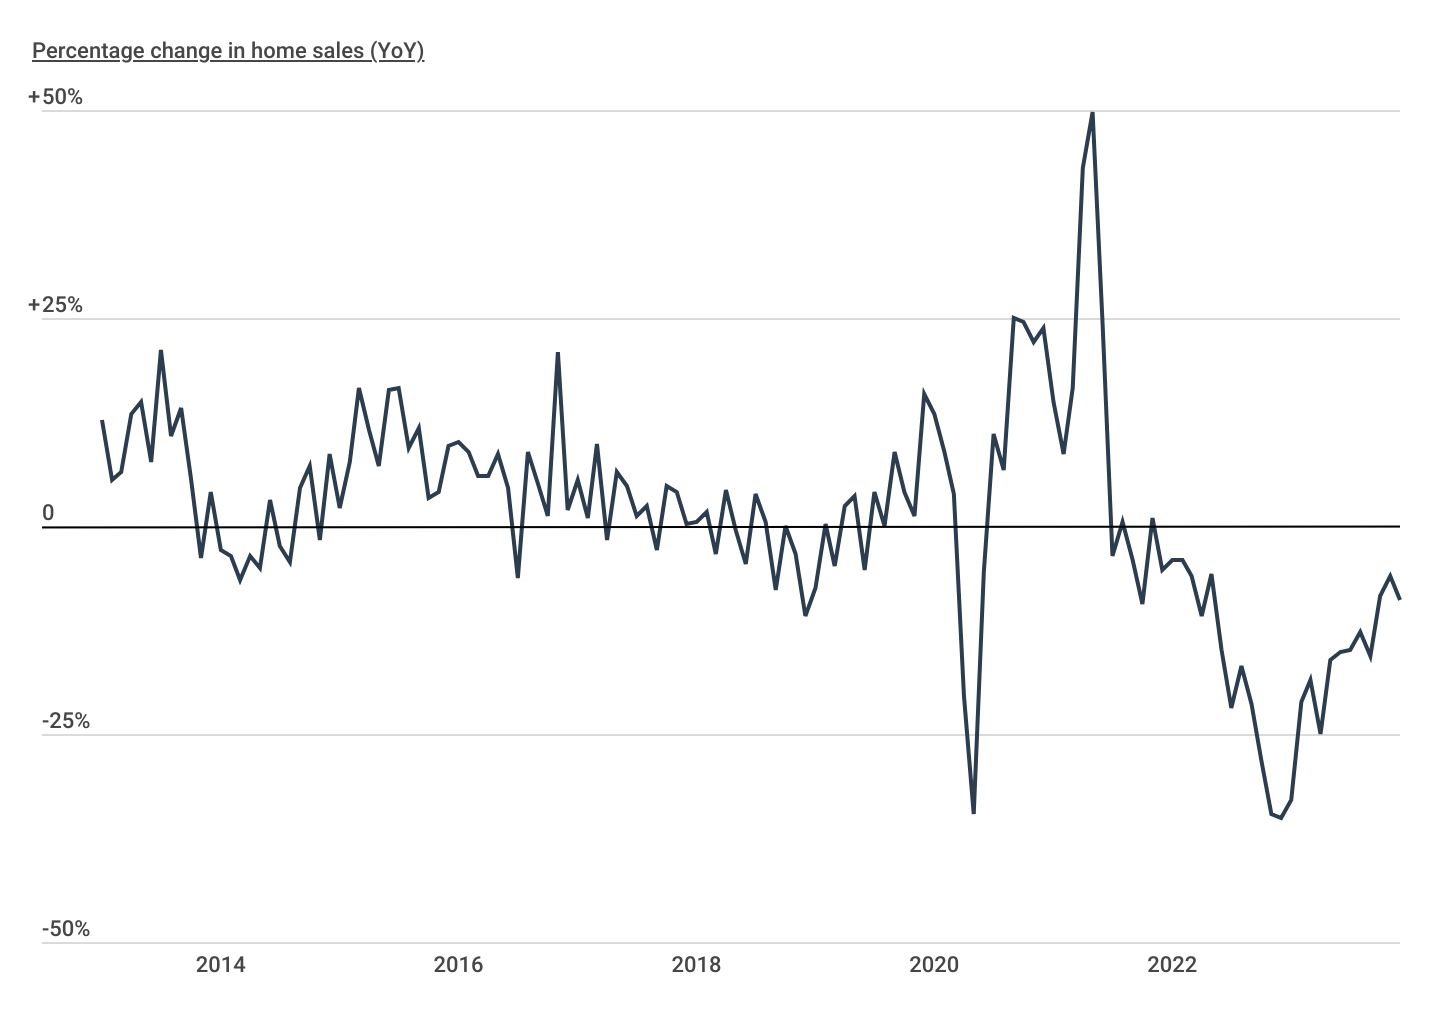
Changes in Home Sales Volume
The volume of home sales declined sharply during 2022 and 2023 and has yet to fully recover

Similar to home prices, the trajectory of home sales has been a roller coaster in recent years. Stay-at-home orders early in the COVID-19 pandemic brought the market to a halt, with the number of home sales declining by more than a third from the spring of 2019 to the spring of 2020. As the market regained momentum, the year-over-year change in home sales reached a record high of 49.8% in May 2021. However, these figures quickly reversed, and by the end of 2022, the volume of home sales was 35.2% lower than the year prior. Though still below historical norms, as of December 2023, home sales were only down 8.8% from the same time a year ago.
FOR CONSTRUCTION BUSINESSES
Improve your construction business’ profitability with construction estimating software—technology designed to streamline the process of creating cost, material, and labor estimates for construction projects.
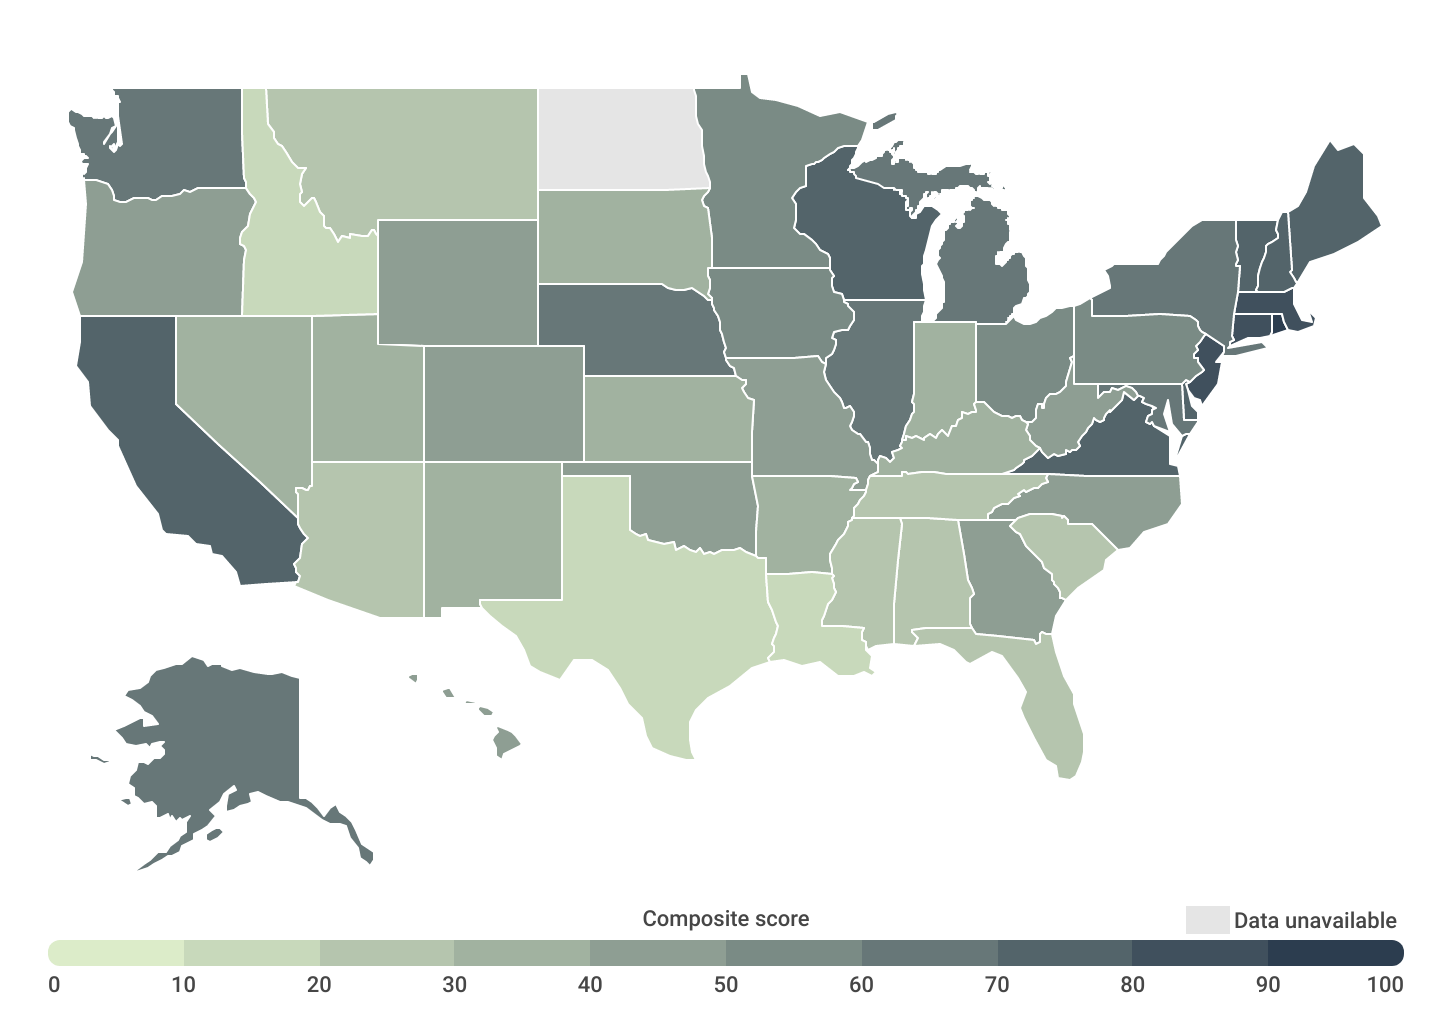
Geographical Differences in Market Conditions
States in the Northeast and California are home to some of the hottest real estate markets

Although the national real estate market is showing moderate signs of heating up, some geographies are seeing more activity than others. To examine these differences, researchers at Construction Coverage developed a composite score using key indicators from Redfin about different local markets. The researchers took into account the following factors:
- One-year change in median sale price (Dec 2022–Dec 2023)
- Share of homes that sold above asking (2023)
- Median number of days on the market (2023)
- Average sale-to-list percentage (2023)
- Share of listings with price drops (2023)
Notably, the Northeast and California have some of the hottest housing markets. Despite being a high cost-of-living region, the Northeast is home to eight of the top 10 composite scores, with Rhode Island leading all states with a score of 91.7. Similarly, California (74.6) is an expensive state with high levels of real estate activity. San Jose, Oakland, and San Diego rank as the top three hottest housing markets among large cities—defined as cities with populations of 350,000 or more. One factor that is likely contributing to increasing prices in these states is the difficulty of adding housing supply. Areas in the Northeast and California have a number of densely populated cities where it is harder to add stock, or regulatory regimes that make it difficult to build new homes.
Meanwhile, areas in the South and Mountain West have cooled off somewhat recently. In 2021, large cities in Texas like Arlington, Fort Worth, and Austin all ranked among the top 15 hottest housing markets. But moving into 2024, those cities all rank in the bottom 15. Similarly, the Mountain West cities of Mesa, AZ and Denver, CO were popular real estate markets during the pandemic, but now both rank in the bottom half of large cities. The rapid growth in home prices in these areas combined with rising return-to-office mandates from employers has made some of these markets less attractive.
For a complete breakdown of these markets, as well as over 600 cities and all 50 states, see the analysis below. Additionally, more information on how each statistic was computed is available in the methodology section.
Large Cities With the Hottest Real Estate Markets
| Top Cities | Score* |
|---|---|
| 1. San Jose, CA | 82.7 |
| 2. Oakland, CA | 73.2 |
| 3. San Diego, CA | 68.4 |
| 4. Virginia Beach, VA | 66.8 |
| 5. Long Beach, CA | 66.4 |
| 6. Boston, MA | 64.6 |
| 7. Omaha, NE | 63.1 |
| 8. Louisville, KY | 61.6 |
| 9. Columbus, OH | 61.0 |
| 10. Sacramento, CA | 59.0 |
| 11. Minneapolis, MN | 58.6 |
| 12. San Francisco, CA | 58.3 |
| 13. Los Angeles, CA | 56.7 |
| 14. El Paso, TX | 54.9 |
| 15. Milwaukee, WI | 53.4 |
| Bottom Cities | Score* |
|---|---|
| 1. New Orleans, LA | 12.5 |
| 2. Austin, TX | 13.1 |
| 3. Philadelphia, PA | 18.2 |
| 4. San Antonio, TX | 19.4 |
| 5. New York, NY | 23.0 |
| 6. Fort Worth, TX | 24.3 |
| 7. Jacksonville, FL | 25.8 |
| 8. Nashville, TN | 26.1 |
| 9. Kansas City, MO | 26.2 |
| 10. Cleveland, OH | 26.5 |
| 11. Mesa, AZ | 30.8 |
| 12. Phoenix, AZ | 31.2 |
| 13. Washington, DC | 31.8 |
| 14. Arlington, TX | 31.8 |
| 15. Memphis, TN | 32.3 |
Midsize Cities With the Hottest Real Estate Markets
| Top Cities | Score* |
|---|---|
| 1. Providence, RI | 81.6 |
| 2. Fremont, CA | 80.0 |
| 3. Garden Grove, CA | 79.1 |
| 4. Aurora, IL | 78.1 |
| 5. Grand Rapids, MI | 77.0 |
| 6. Hayward, CA | 77.0 |
| 7. Rochester, NY | 76.4 |
| 8. Irvine, CA | 75.5 |
| 9. Springfield, MA | 74.7 |
| 10. Buffalo, NY | 74.6 |
| 11. Anaheim, CA | 73.4 |
| 12. Richmond, VA | 73.0 |
| 13. Madison, WI | 72.9 |
| 14. Escondido, CA | 72.4 |
| 15. Chula Vista, CA | 72.4 |
| Bottom Cities | Score* |
|---|---|
| 1. Cape Coral, FL | 15.2 |
| 2. Scottsdale, AZ | 19.8 |
| 3. Amarillo, TX | 19.9 |
| 4. Surprise, AZ | 20.4 |
| 5. Port St. Lucie, FL | 24.4 |
| 6. Montgomery, AL | 24.8 |
| 7. Baton Rouge, LA | 24.8 |
| 8. Tempe, AZ | 25.3 |
| 9. Lubbock, TX | 25.7 |
| 10. Fort Lauderdale, FL | 25.8 |
| 11. Henderson, NV | 26.1 |
| 12. Spring Valley, NV | 26.2 |
| 13. St. Petersburg, FL | 26.4 |
| 14. Gilbert, AZ | 27.4 |
| 15. Murfreesboro, TN | 27.9 |
Small Cities With the Hottest Real Estate Markets
| Top Cities | Score* |
|---|---|
| 1. Malden, MA | 89.4 |
| 2. Nashua, NH | 89.0 |
| 3. Pawtucket, RI | 88.8 |
| 4. Lynn, MA | 87.8 |
| 5. Milpitas, CA | 87.3 |
| 6. Cranston, RI | 85.8 |
| 7. Cheektowaga, NY | 85.7 |
| 8. Dublin, CA | 85.6 |
| 9. Norwalk, CT | 84.9 |
| 10. Santa Clara, CA | 84.5 |
| 11. Brockton, MA | 84.2 |
| 12. Manchester, NH | 83.7 |
| 13. Centreville, VA | 83.6 |
| 14. Mountain View, CA | 83.0 |
| 15. Warwick, RI | 82.7 |
| Bottom Cities | Score* |
|---|---|
| 1. Leander, TX | 6.8 |
| 2. Round Rock, TX | 10.6 |
| 3. Metairie, LA | 10.9 |
| 4. New Braunfels, TX | 11.0 |
| 5. Jackson, MS | 11.4 |
| 6. Conroe, TX | 11.9 |
| 7. Goodyear, AZ | 12.0 |
| 8. Idaho Falls, ID | 14.1 |
| 9. Kenner, LA | 14.3 |
| 10. Delray Beach, FL | 14.3 |
| 11. North Port, FL | 15.1 |
| 12. Mansfield, TX | 15.1 |
| 13. Georgetown, TX | 15.9 |
| 14. Pflugerville, TX | 16.1 |
| 15. Cedar Park, TX | 17.9 |
States With the Hottest Real Estate Markets
| Top States | Score* |
|---|---|
| 1. Rhode Island | 91.7 |
| 2. Connecticut | 87.5 |
| 3. Massachusetts | 86.7 |
| 4. New Jersey | 85.4 |
| 5. Virginia | 77.1 |
| 6. Maine | 76.7 |
| 7. Vermont | 75.0 |
| 8. California | 74.6 |
| 9. New Hampshire | 74.6 |
| 10. Delaware | 70.9 |
| 11. Wisconsin | 70.8 |
| 12. New York | 68.8 |
| 13. Maryland | 68.8 |
| 14. Alaska | 66.3 |
| 15. Michigan | 64.6 |
| Bottom States | Score* |
|---|---|
| 1. Louisiana | 11.2 |
| 2. Idaho | 15.4 |
| 3. Texas | 16.2 |
| 4. Montana | 22.5 |
| 5. Florida | 23.3 |
| 6. Mississippi | 23.8 |
| 7. Arizona | 24.2 |
| 8. South Carolina | 24.6 |
| 9. Tennessee | 25.4 |
| 10. Alabama | 26.3 |
| 11. New Mexico | 30.8 |
| 12. Nevada | 31.3 |
| 13. Utah | 31.7 |
| 14. Kansas | 35.0 |
| 15. Kentucky | 37.5 |
*Composite score
Detailed Findings & Methodology
The data used in this analysis is from Redfin’s Data Center. To determine the locations with the hottest real estate markets in 2024, researchers at Construction Coverage created a composite score, equally weighting the following metrics:
- One-year change in median sale price (Dec 2022–Dec 2023)
- Share of homes that sold above asking (2023)
- Median number of days on the market (2023)
- Average sale-to-list percentage (2023)
- Share of listings with price drops (2023)
In the event of a tie, the location with the greater one-year change in median sale price was ranked higher. Researchers also reported the median home sale price from December 2023. Cities were grouped into cohorts based on population size: small (less than 150,000), midsize (150,000–349,999), and large (350,000 or more). Note, locations with insufficient data were excluded for quality purposes.
References
- U.S. Census Bureau and U.S. Department of Housing and Urban Development. (2024, January 25). Median Sales Price of Houses Sold for the United States. FRED, Federal Reserve Bank of St. Louis. https://fred.stlouisfed.org/series/MSPUS. Retrieved February 15, 2024.
- U.S. Bank. (2024, February 1). The impact of today’s higher interest rates on the housing market. https://www.usbank.com/investing/financial-perspectives/investing-insights/interest-rates-impact-on-housing-market.html. Retrieved February 15, 2024.
- Freddie Mac. (2024, February 15). 30-Year Fixed Rate Mortgage Average in the United States. FRED, Federal Reserve Bank of St. Louis. https://fred.stlouisfed.org/series/MORTGAGE30US. Retrieved February 15, 2024.
Full Results
Each company featured in our guides has been independently selected and reviewed by our research team. If you select one of these companies and click on a link, we may earn a commission.
By clicking on these links, you may be taken to one of our insurance partners. The specific company listed here may or may not be included in our partner’s network at this time.
