American Cities With the Worst Littering Problem [2022 Edition]
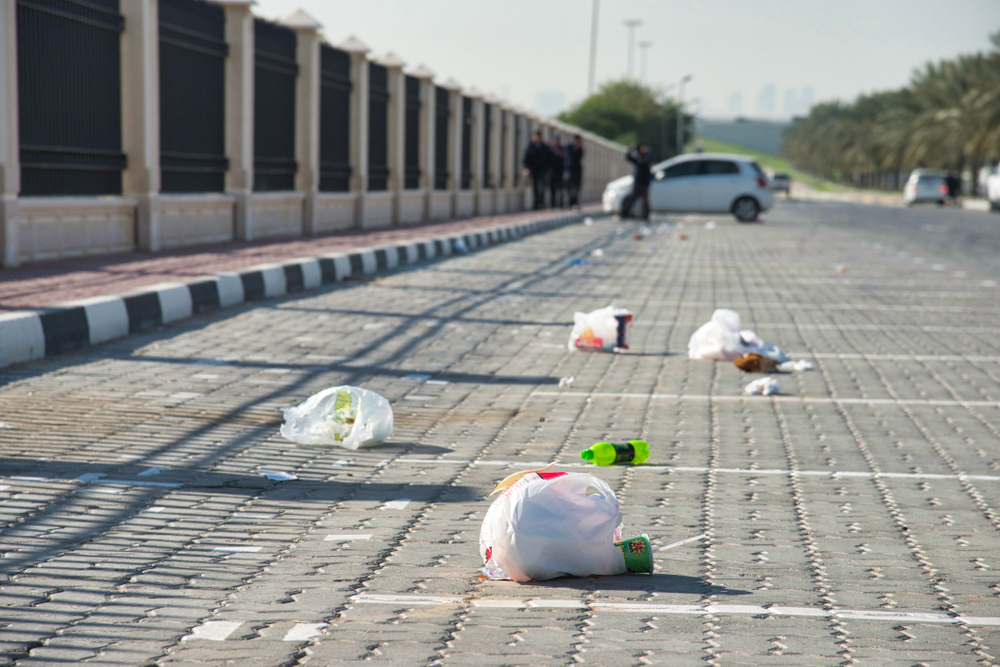
Litter is a nationwide problem, but communities across the country have significantly different experiences with waste. According to the 2020 National Litter Study from Keep America Beautiful, there are nearly 50 billion pieces of litter in U.S. roadways and waterways, and 90% of U.S. residents agree that litter is a problem in their state. But recent trends in litter are K-shaped, meaning that some communities—with more resources for cleanup or behavioral and economic characteristics that discourage littering—have seen decreases over time, while others have had more litter in recent years.
These diverging trends in litter are also evident within certain cities, especially those where economic disparities are growing. In recent years, cities like Los Angeles, San Francisco, Seattle, and Portland have seen widening gulfs between their highest-earning and lowest-earning residents. Residents who have greater means or are living in wealthier parts of these communities may encounter litter less often, while lower-income neighborhoods may see more dumping and waste. Growing homeless populations in these cities may also increase the presence of litter, as large encampments produce more waste near streets and roadways.
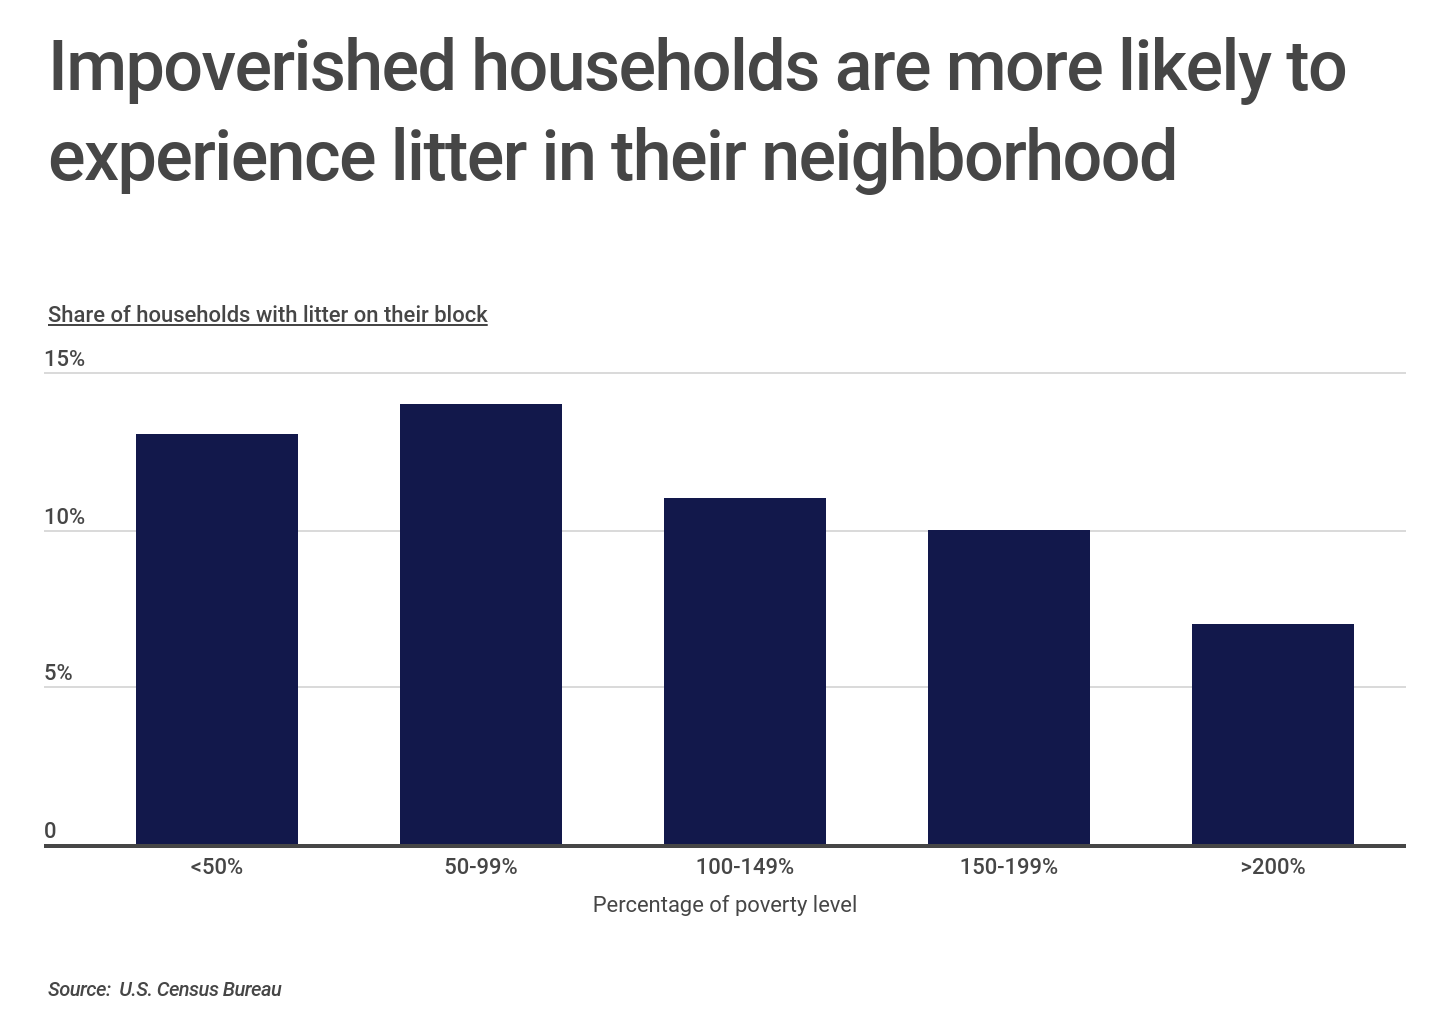
Census data confirms the relationship between economic inequality and litter, as low income households are more likely to encounter litter in their immediate area. Neighborhoods where the typical household is below the poverty line report litter on their blocks much more commonly than well-off households. Households above 200% of the poverty level report litter in the areas around their homes half as often as households between 50% and 99% of the poverty level (7% vs. 14%).
These disparities are meaningful because litter is more than just a nuisance or an eyesore. Misplaced trash can be a safety issue, making roadways more dangerous to navigate, clogging up stormwater and wastewater systems, and increasing fire risks. Wildlife can be trapped or injured by litter, and the presence of litter can also contribute to soil and water pollution, which creates an unhealthy environment for both wildlife and humans. And litter can also inhibit the economic development that lower-income areas need: areas with large amounts of litter may face lower property values, fewer visits from tourists and shoppers, and greater difficulty recruiting businesses.
RELATED
Landlord insurance is a type of commercial building insurance that protects landlords from liability issues and property damage. In our new guide, we compare landlord insurance companies based on price, reviews, coverage, and more.
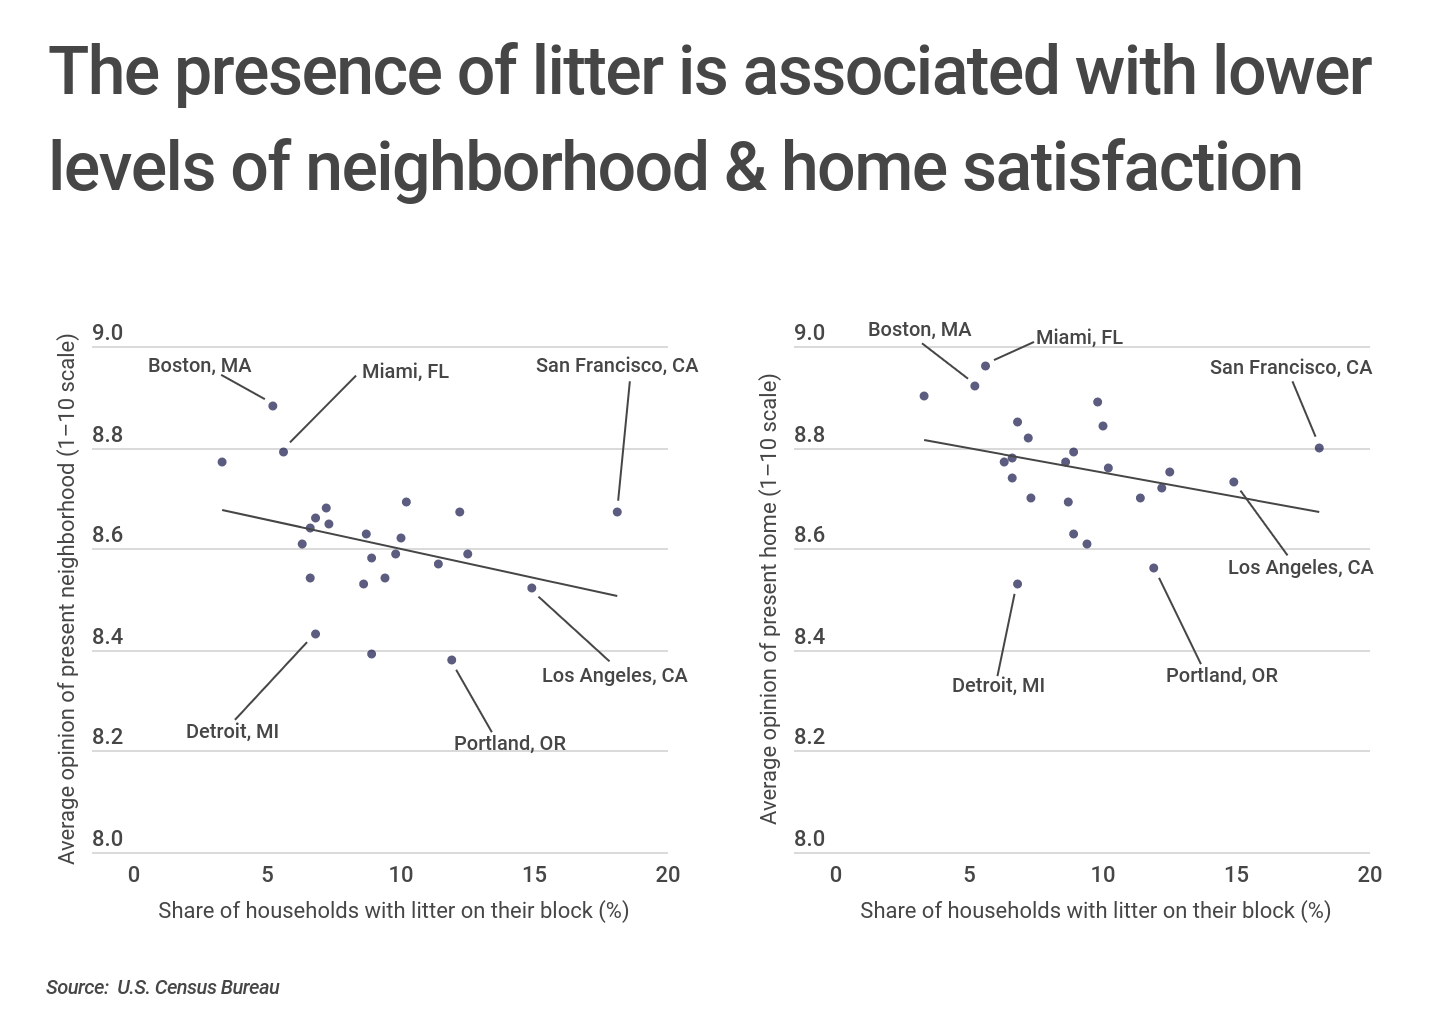
Factors like these make heavily littered areas less pleasant to live in. Survey data shows a negative correlation between litter and people’s opinion of their homes and neighborhoods. When asked to rate their neighborhood and home on a scale of 1 to 10, households without litter on their block tended to respond more highly.
The data used in this analysis is from the U.S. Census Bureau’s American Housing Survey. To determine the locations with the worst littering problem, researchers at Construction Coverage calculated the share of households with litter on their block, ranking them from high to low. In the event of a tie, the location with the lower average opinion of their present neighborhood (on a 1-10 scale) was ranked higher. Only select metropolitan areas and states with data available from the American Housing Survey were considered in the analysis.
Here are the major U.S. metros with the worst littering problem.
Large Metros With the Worst Littering Problem
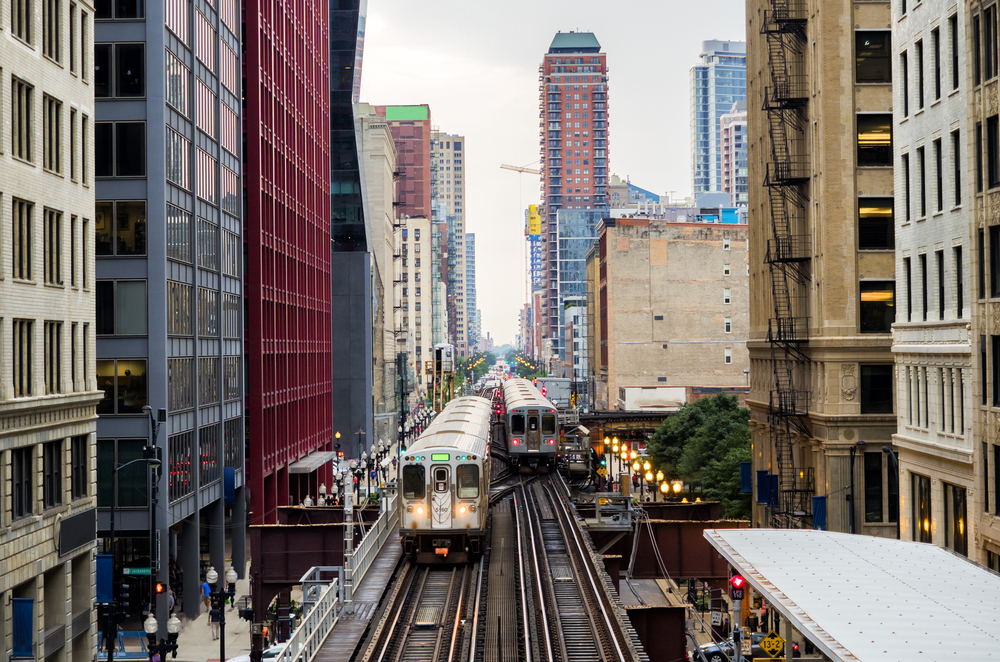
Photo Credit: wonderlustpicstravel / Shutterstock
10. Chicago, IL
- Share of households with litter on their block: 9.4%
- Average opinion of present neighborhood (1-10 scale): 8.54
- Average opinion of present home (1-10 scale): 8.61
- Median household income: $72,000
- Median home purchase price: $188,000
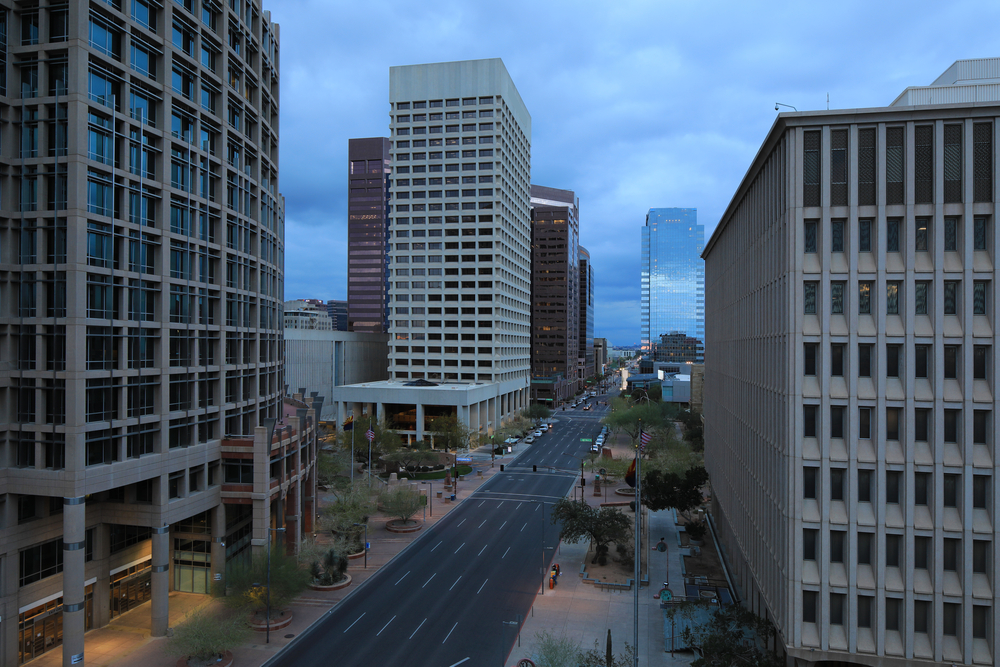
Photo Credit: Harold Stiver / Shutterstock
9. Phoenix, AZ
- Share of households with litter on their block: 9.8%
- Average opinion of present neighborhood (1-10 scale): 8.59
- Average opinion of present home (1-10 scale): 8.89
- Median household income: $64,000
- Median home purchase price: $195,000
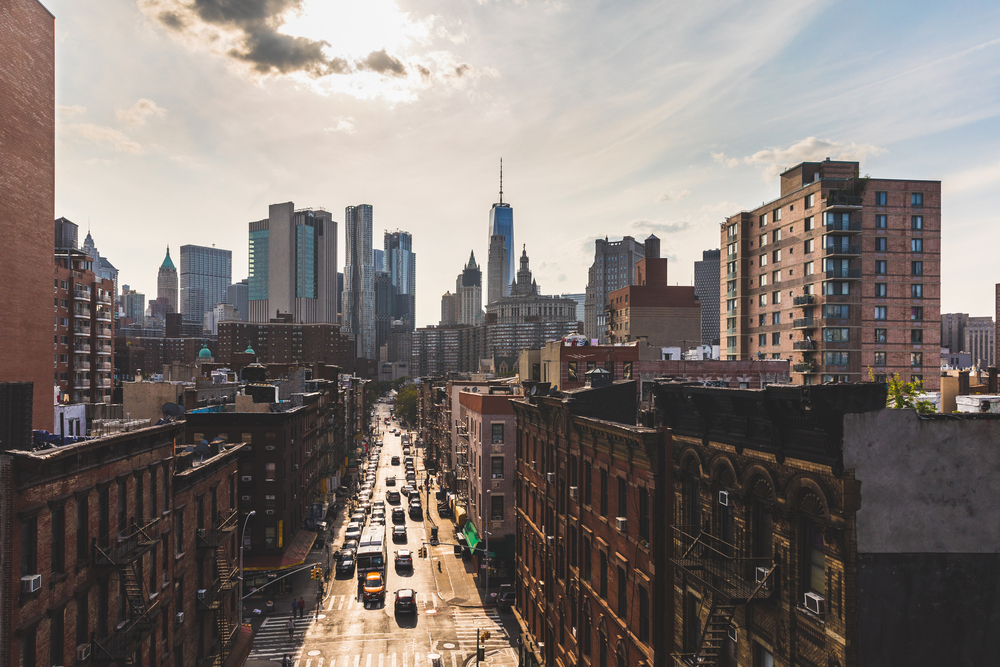
Photo Credit: William Perugini / Shutterstock
8. New York, NY
- Share of households with litter on their block: 10.0%
- Average opinion of present neighborhood (1-10 scale): 8.62
- Average opinion of present home (1-10 scale): 8.84
- Median household income: $70,000
- Median home purchase price: $270,000
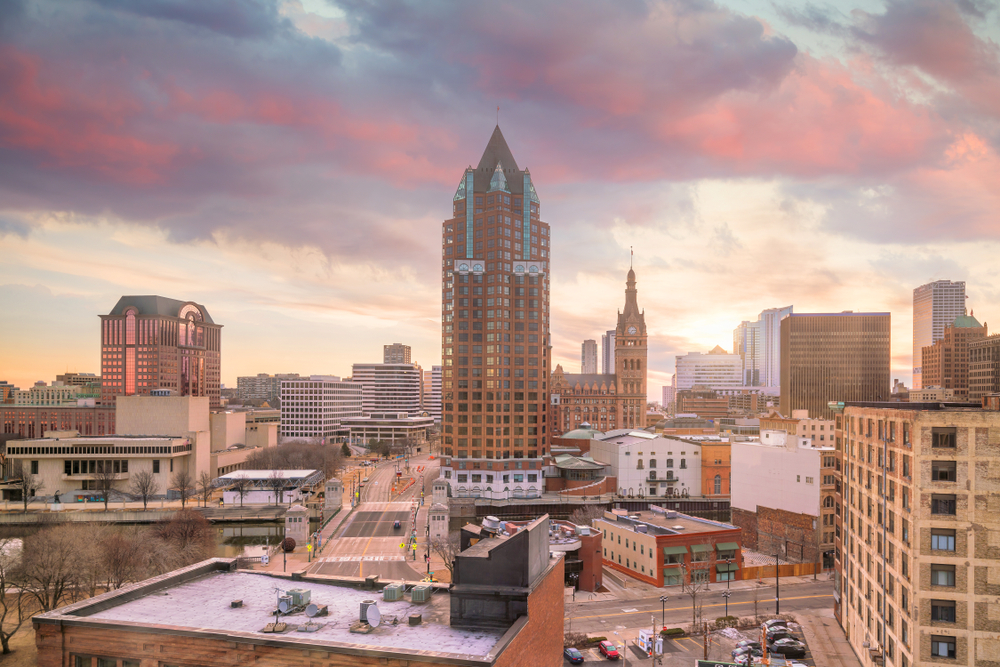
Photo Credit: f11photo / Shutterstock
7. Milwaukee, WI
- Share of households with litter on their block: 10.2%
- Average opinion of present neighborhood (1-10 scale): 8.69
- Average opinion of present home (1-10 scale): 8.76
- Median household income: $60,000
- Median home purchase price: $160,000
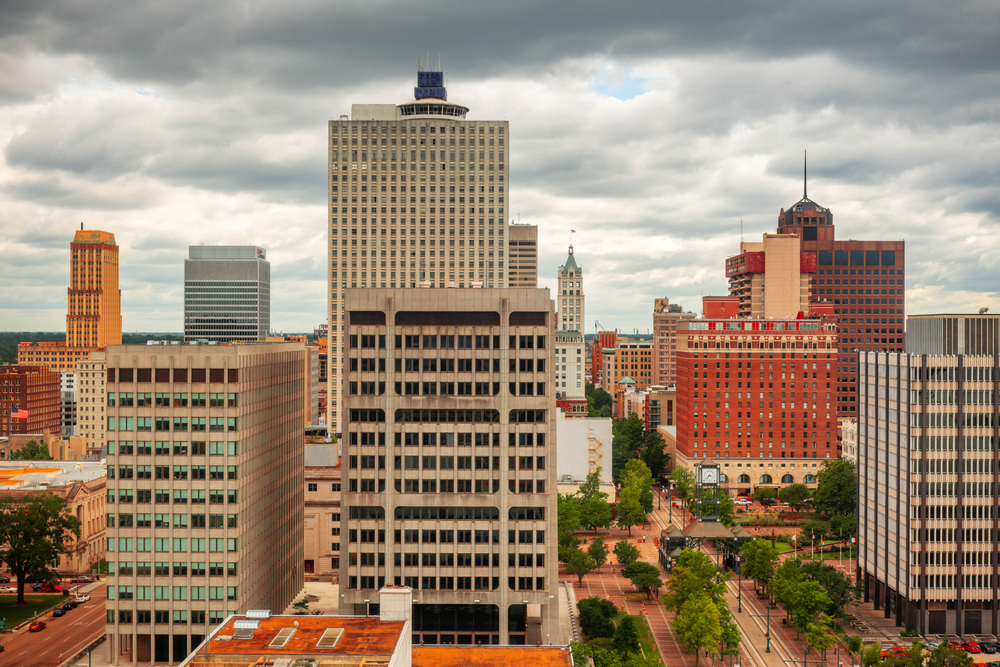
Photo Credit: Sean Pavone / Shutterstock
6. Memphis, TN
- Share of households with litter on their block: 11.4%
- Average opinion of present neighborhood (1-10 scale): 8.57
- Average opinion of present home (1-10 scale): 8.70
- Median household income: $45,000
- Median home purchase price: $129,000
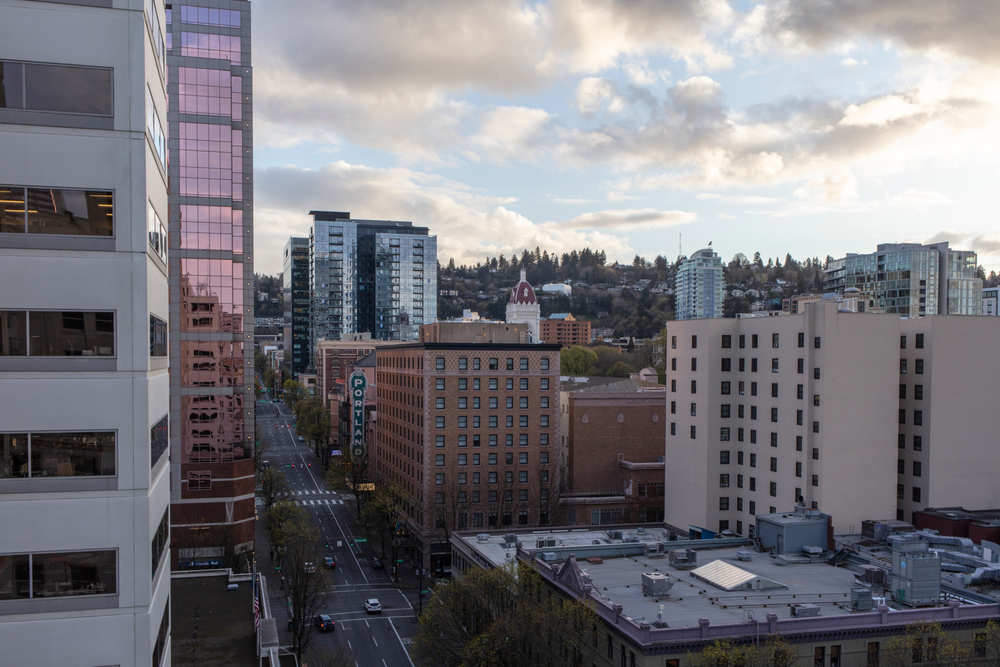
Photo Credit: Xiao Zhou / Shutterstock
5. Portland, OR
- Share of households with litter on their block: 11.9%
- Average opinion of present neighborhood (1-10 scale): 8.38
- Average opinion of present home (1-10 scale): 8.56
- Median household income: $75,300
- Median home purchase price: $240,000
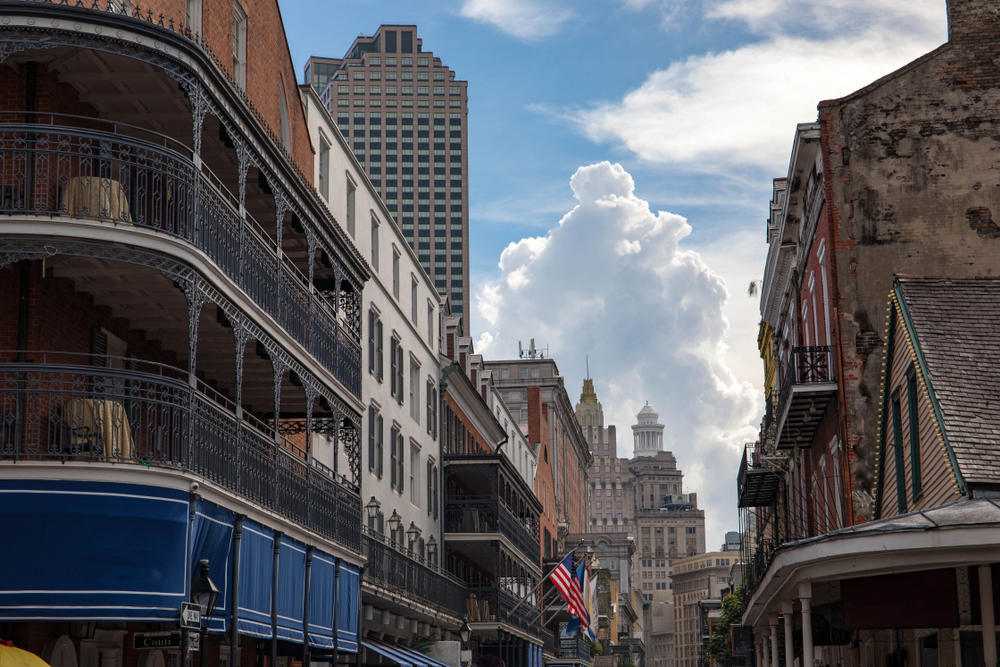
Photo Credit: evenfh / Shutterstock
4. New Orleans, LA
- Share of households with litter on their block: 12.2%
- Average opinion of present neighborhood (1-10 scale): 8.67
- Average opinion of present home (1-10 scale): 8.72
- Median household income: $48,600
- Median home purchase price: $140,000
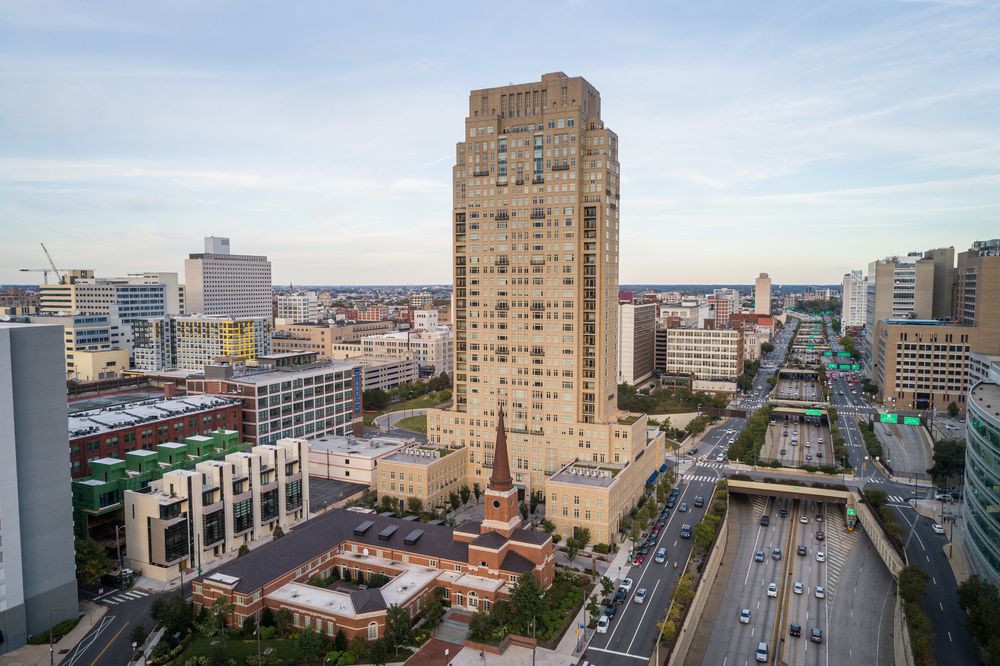
Photo Credit: photosounds / Shutterstock
3. Philadelphia, PA
- Share of households with litter on their block: 12.5%
- Average opinion of present neighborhood (1-10 scale): 8.59
- Average opinion of present home (1-10 scale): 8.75
- Median household income: $71,570
- Median home purchase price: $175,000
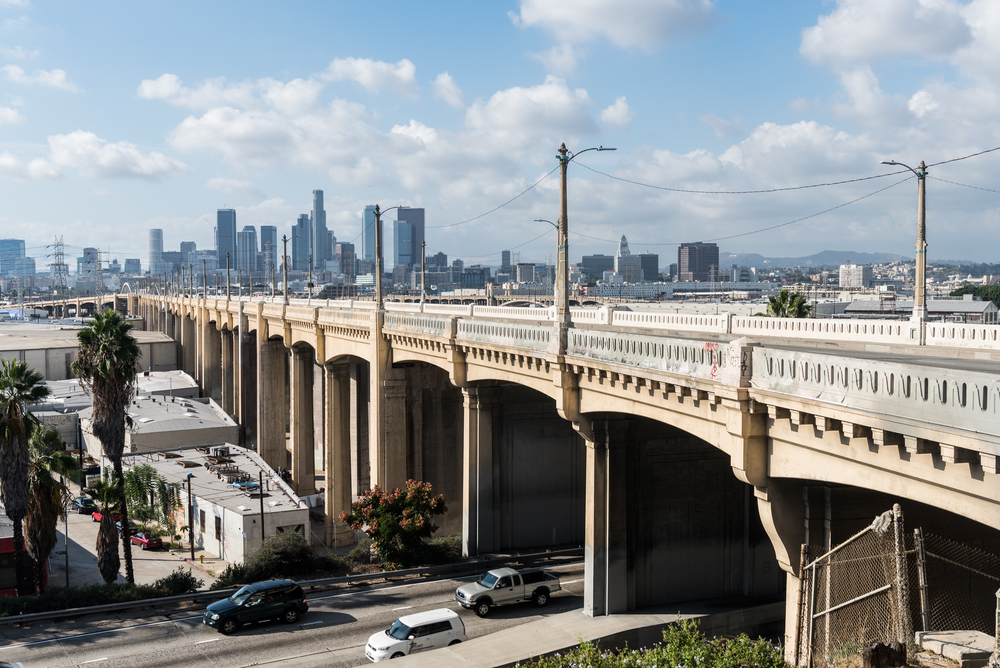
Photo Credit: Hayk_Shalunts / Shutterstock
2. Los Angeles, CA
- Share of households with litter on their block: 14.9%
- Average opinion of present neighborhood (1-10 scale): 8.52
- Average opinion of present home (1-10 scale): 8.73
- Median household income: $75,000
- Median home purchase price: $300,000
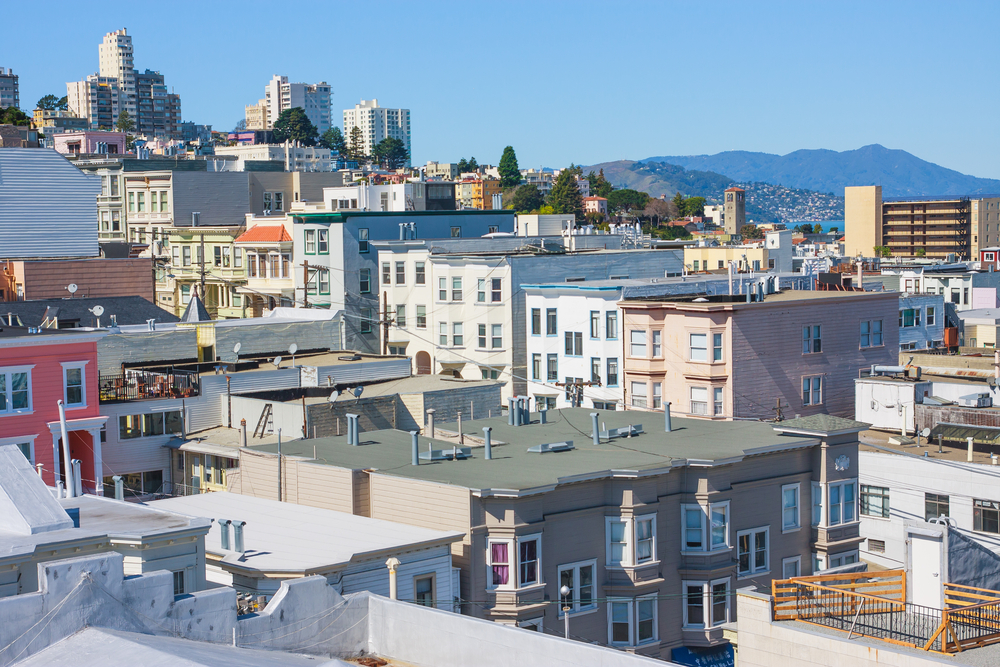
Photo Credit: Radoslaw Lecyk / Shutterstock
1. San Francisco, CA
- Share of households with litter on their block: 18.1%
- Average opinion of present neighborhood (1-10 scale): 8.67
- Average opinion of present home (1-10 scale): 8.80
- Median household income: $106,000
- Median home purchase price: $456,000
Detailed Findings & Methodology
The data used in this analysis is from the U.S. Census Bureau’s American Housing Survey for the year 2019, the most recent data available. To determine the locations with the worst littering problem, researchers calculated the share of households with litter on their block, ranking them from high to low. In the event of a tie, the location with the lower average opinion of their present neighborhood (1-10 scale) was ranked higher. Only select metropolitan areas and states with data available from the American Housing Survey were considered in the analysis.