
U.S. Cities Investing the Most in Home Improvements
Note: This is the most recent release of our U.S. Cities Investing the Most in Home Improvements study. To see data from previous years, please visit the Full Results section below.
During the early days of the COVID-19 pandemic, homeowners nationwide used their spare time to tackle overdue home projects. As the year continued, a combination of factors, including low interest rates and rising home prices, helped fuel a surge in home renovations, improvements, and remodels.
These trends persisted into 2022, but a combination of economic uncertainty, sluggish home sales, and rising rates led to a slight decrease in home improvement spending. However, recent data from the Joint Center for Housing Studies at Harvard University indicates that the slowdown in home improvement spending is likely temporary and that spending levels should trend up through the first half of 2025.
U.S. Home Improvement Spending Over Time
After surging over the past decade, home improvement spending pulled back in 2023
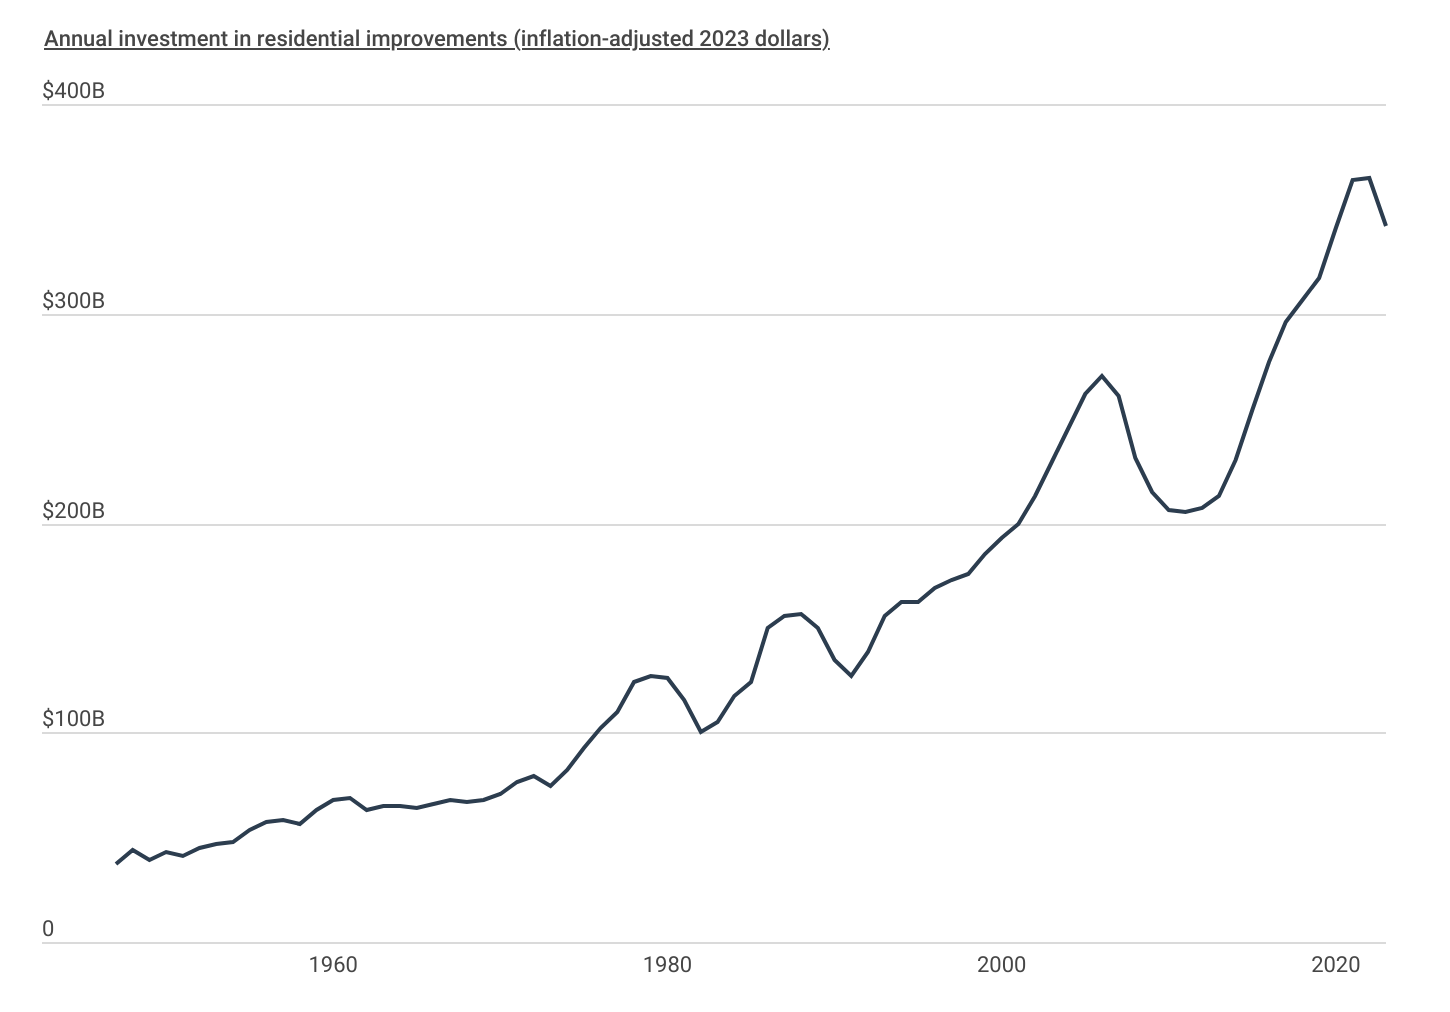
After falling by an inflation-adjusted 24% from a high in 2006 to a low in 2011 as a result of the Great Recession, home improvement spending growth got back on track between 2012 and 2019 as the housing market recovered. However, spending then grew sharply during the height of the COVID-19 pandemic before plateauing in 2022 and declining in 2023. According to loan-level data from the Home Mortgage Disclosure Act, the number of single-family home improvement loans originated climbed to nearly 745,000 in 2022 before subsequently declining to 565,000 in 2023.
Typically, home improvement spending falls during economic downturns; however, the COVID-19 recession proved to be an exception to the rule. One key reason is that the early stages of the pandemic disproportionately impacted lower-wage workers who were less likely to own homes. Meanwhile, higher-income homeowners didn’t suffer the same level of job losses or reduced wages but benefited from reduced spending on things like eating out and travel, which freed up funds for other expenses. With many of these homeowners spending more time at home, they were eager to create home offices, gyms, and backyard oases featuring decks, outdoor kitchens, and pools.
RELATED
If you operate a business out of your home, you might need commercial property insurance. This is because homeowners policies often have clauses that exclude properties used for commercial purposes. Similarly, personal auto insurance won’t cover vehicles used for business purposes—for instance, a general contractor using his truck to transport goods to a renovation project. Check out our recently updated guide on the best commercial truck insurance policies to learn more.
Home Improvement Loan Approvals by Location
Utah residents invested most in home improvements in 2023
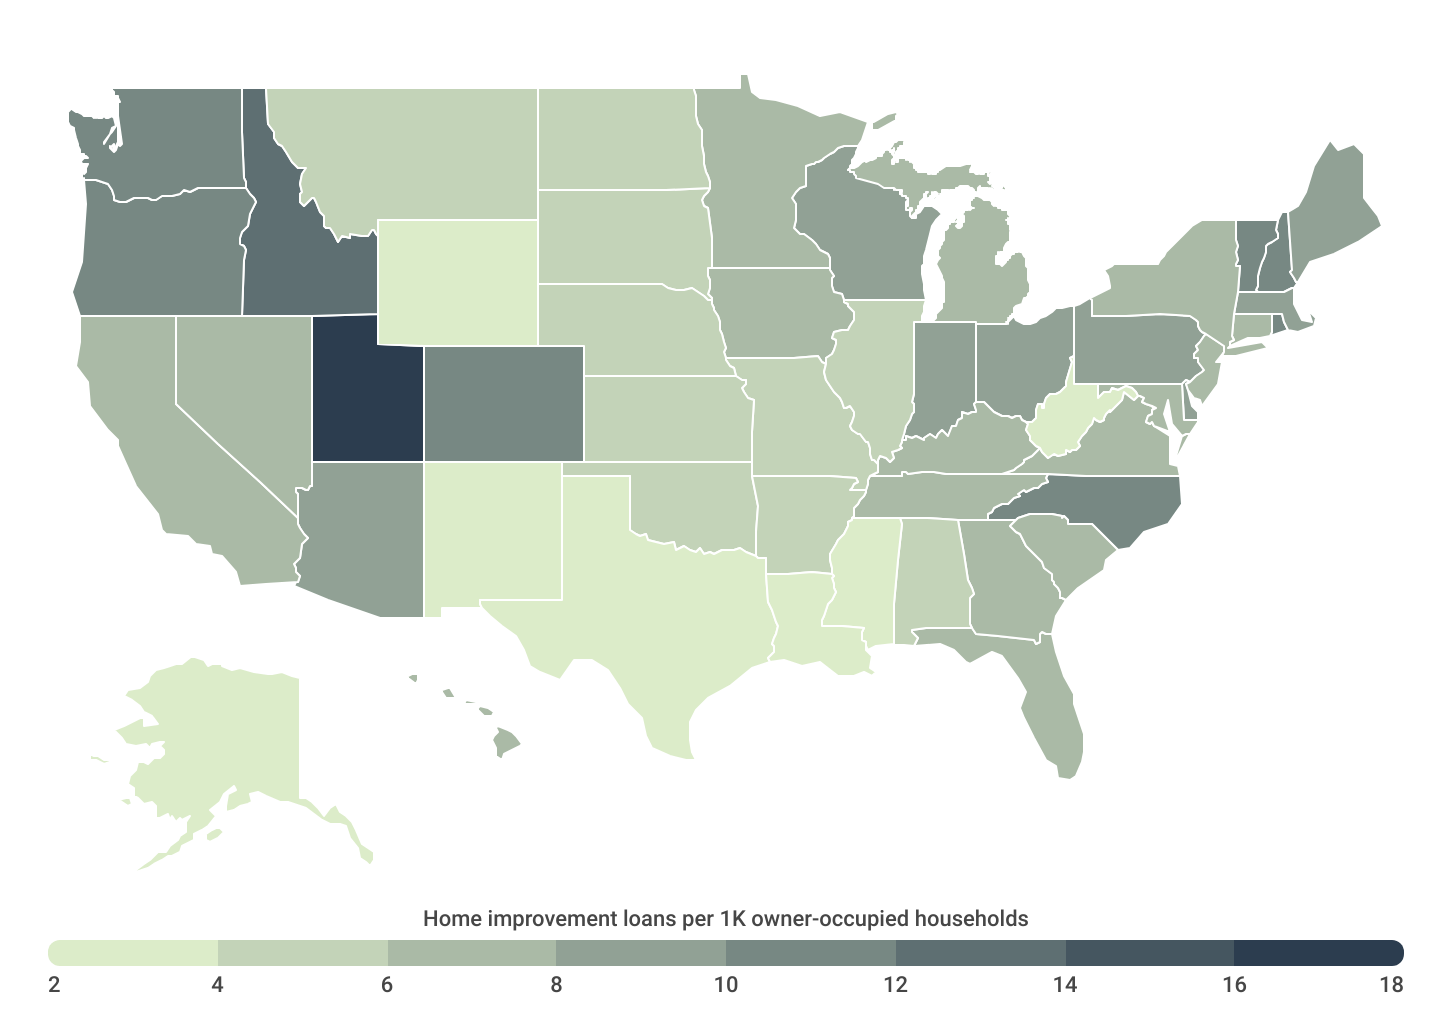
Investing in home improvements varies by location due to factors such as cost of living, local economic conditions, and the housing market. Notably, the Pacific Northwest, Mountain West, and New England stand out for their high spending in 2023.
At the state level, homeowners in Utah and Idaho—two of the top 10 fastest-growing states—took out the most home improvement loans at 17.0 and 13.0 loans per 1,000 homeowners, respectively. Other top states include neighboring Oregon, Colorado, and Washington, as well as Rhode Island, New Hampshire, Vermont, and Massachusetts in New England. At the other end of the spectrum, homeowners in Louisiana took out the fewest home improvement loans, at just 2.1 loans per 1,000 homeowners.
Similar trends hold at the local level where fast-growing parts of Utah, Idaho, Colorado, Washington, and Oregon claim many of the top spots for home improvement spending. The Salt Lake City metro ranks first among large metros; Ogden and Provo, UT claim the top two spots among midsize metros; and the Logan, UT-ID metro area sits at the top of the small metros list, followed closely by St. George, UT.
Below is a complete breakdown of cities investing most in home improvements for over 370 metropolitan areas and all 50 states. The research was conducted by Construction Coverage, using the latest data from the Home Mortgage Disclosure Act. For more information, see the methodology section below.
Large Metros Investing Most in Home Improvements
| Top Metros | Loans* |
|---|---|
| 1. Salt Lake City-Murray, UT | 15.3 |
| 2. Raleigh-Cary, NC | 13.8 |
| 3. Milwaukee-Waukesha, WI | 12.5 |
| 4. Grand Rapids-Wyoming-Kentwood, MI | 12.2 |
| 5. Portland-Vancouver-Hillsboro, OR-WA | 11.7 |
| 6. Providence-Warwick, RI-MA | 11.4 |
| 7. Charlotte-Concord-Gastonia, NC-SC | 11.2 |
| 8. Denver-Aurora-Centennial, CO | 11.0 |
| 9. Columbus, OH | 10.9 |
| 10. Rochester, NY | 10.2 |
| 11. Seattle-Tacoma-Bellevue, WA | 10.1 |
| 12. San Diego-Chula Vista-Carlsbad, CA | 10.0 |
| 13. Phoenix-Mesa-Chandler, AZ | 9.8 |
| 14. Boston-Cambridge-Newton, MA-NH | 9.8 |
| 15. Indianapolis-Carmel-Greenwood, IN | 9.7 |
| Bottom Metros | Loans* |
|---|---|
| 1. San Antonio-New Braunfels, TX | 2.4 |
| 2. Houston-Pasadena-The Woodlands, TX | 2.6 |
| 3. Austin-Round Rock-San Marcos, TX | 3.6 |
| 4. Dallas-Fort Worth-Arlington, TX | 4.1 |
| 5. Memphis, TN-MS-AR | 4.8 |
| 6. Chicago-Naperville-Elgin, IL-IN | 4.8 |
| 7. San Jose-Sunnyvale-Santa Clara, CA | 5.3 |
| 8. New York-Newark-Jersey City, NY-NJ | 5.4 |
| 9. Oklahoma City, OK | 5.7 |
| 10. San Francisco-Oakland-Fremont, CA | 5.8 |
| 11. Fresno, CA | 5.9 |
| 12. Baltimore-Columbia-Towson, MD | 6.0 |
| 13. Jacksonville, FL | 6.3 |
| 14. Miami-Fort Lauderdale-West Palm Beach, FL | 6.3 |
| 15. Tucson, AZ | 6.4 |
FOR CONSTRUCTION BUSINESSES
Whether your business focuses on remodels or new construction, having the right software can make every step of the process easier. We recommend construction estimating and takeoff software to improve the bid process. For managing ongoing projects and finances, we recommend construction accounting software and construction management software.
States Investing Most in Home Improvements
| Top States | Loans* |
|---|---|
| 1. Utah | 17.0 |
| 2. Idaho | 13.0 |
| 3. Rhode Island | 11.8 |
| 4. New Hampshire | 11.5 |
| 5. Oregon | 10.6 |
| 6. Vermont | 10.5 |
| 7. Colorado | 10.2 |
| 8. Washington | 10.1 |
| 9. North Carolina | 10.0 |
| 10. Massachusetts | 9.9 |
| 11. Maine | 9.8 |
| 12. Pennsylvania | 9.4 |
| 13. Wisconsin | 9.2 |
| 14. Ohio | 8.6 |
| 15. Arizona | 8.3 |
| Bottom States | Loans* |
|---|---|
| 1. Louisiana | 2.1 |
| 2. Mississippi | 2.7 |
| 3. Texas | 2.7 |
| 4. Alaska | 3.2 |
| 5. Wyoming | 3.6 |
| 6. West Virginia | 3.6 |
| 7. New Mexico | 3.7 |
| 8. Illinois | 4.1 |
| 9. Arkansas | 4.9 |
| 10. Alabama | 5.1 |
| 11. Kansas | 5.3 |
| 12. Oklahoma | 5.3 |
| 13. North Dakota | 5.4 |
| 14. Nebraska | 5.4 |
| 15. Missouri | 5.5 |
*Home improvement loans per 1K owner-occupied households
Full Results
Methodology
To find the locations investing the most in home improvements, researchers at Construction Coverage analyzed the latest data from the Federal Financial Institutions Examination Council’s 2023 Home Mortgage Disclosure Act, the U.S. Census Bureau’s 2022 American Community Survey, and Zillow’s Zillow Home Value Index. The researchers ranked metros according to the number of home improvement loans per 1,000 owner-occupied households. In the event of a tie, the metro with the larger number of total annual home improvement loans was ranked higher. Researchers also calculated the median home-improvement loan amount, median home-improvement loan interest rate, and median home price.
Only conventional, single-family, home-improvement loans that were originated in 2023 were considered in the analysis. To improve relevance, only locations with complete data were included, and metro areas were grouped into the following cohorts based on population size:
- Small metros: less than 350,000
- Midsize metros: 350,000-999,999
- Large metros: 1,000,000 or more
References
- Will, A. (July 18, 2024). Remodeling Spending to Tick Up Through Mid-Year 2025. Joint Center for Housing Studies of Harvard University. https://www.jchs.harvard.edu/blog/remodeling-spending-tick-through-mid-year-2025.
- U.S. Consumer Financial Protection Bureau (2023). Home Mortgage Disclosure Act. https://www.consumerfinance.gov/data-research/hmda/.
- Bateman, N. and Ross, M. (July 28, 2021). The Pandemic Hurt Low-Wage Workers The Most—And So Far, The Recovery Has Helped Them The Least. The Brookings Institute. https://www.brookings.edu/articles/the-pandemic-hurt-low-wage-workers-the-most-and-so-far-the-recovery-has-helped-them-the-least/.
- Aladangady, A et al. (October 21, 2022). FEDS Notes: Excess Savings during the COVID-19 Pandemic. Board of Governors of the Federal Reserve System. https://www.federalreserve.gov/econres/notes/feds-notes/excess-savings-during-the-covid-19-pandemic-20221021.html.
- McKinsey Global Institute. (March 17, 2021). The Consumer Demand Recovery And Lasting Effects of COVID-19. https://www.mckinsey.com/industries/consumer-packaged-goods/our-insights/the-consumer-demand-recovery-and-lasting-effects-of-covid-19.
- U.S. Census Bureau (2022). American Community Survey 5-Year Estimates. https://www.census.gov/programs-surveys/acs.
- Zillow (August 2024). Zillow Home Value Index. https://www.zillow.com/research/zhvi-methodology/.