
States Where You Are Most Likely to Get Your Identity Stolen
Coronavirus-related scams have proliferated in recent weeks. According to the Federal Trade Commission (FTC), some businesses have already been reprimanded for misleading claims around coronavirus treatments and cures. But not all scams are related to false advertising. Other common scams include fraudulent online vendors claiming to sell in-demand goods, fake charities soliciting donations, robocalls pushing phony products, and phishing emails designed to trick victims into sharing personal information. One obvious consequence for victims of these scams is losing money. Another major threat is identity theft, which has been on the rise for the past few years.
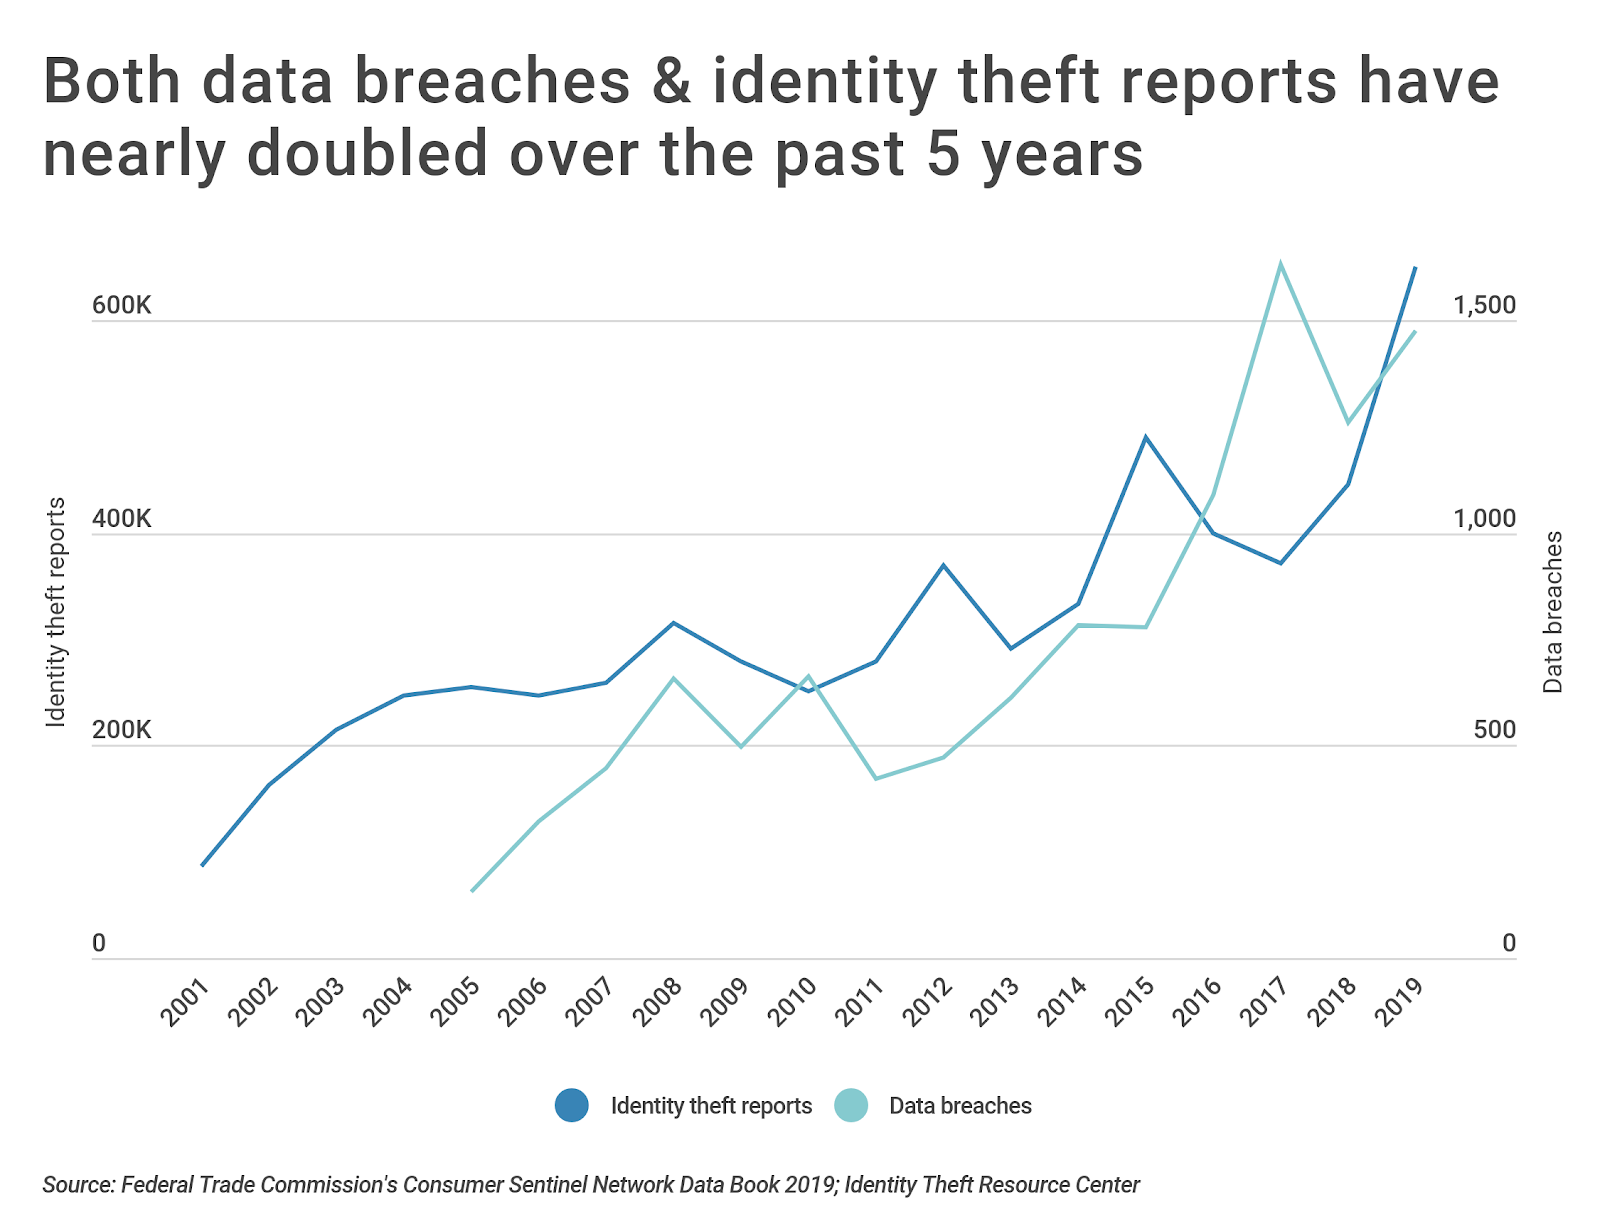
In 2019, the FTC received 650,572 identity theft reports—about 198 per 100,000 residents. These numbers represent an astonishing 46 percent increase since 2018 and nearly a 100 percent increase over the past five years. Coinciding with the rise in identity theft reports is an increase in data breaches—incidents in which an individual’s name and private or confidential information is exposed.
The Identity Theft Resource Center (ITRC) reported 1,473 data breaches in 2019, over nine times the number in 2005 when the ITRC first started tracking data breaches. While not all data breaches lead to identity theft, a larger number of data breaches means that more Americans have their personal information exposed, increasing the likelihood that identity theft will occur.
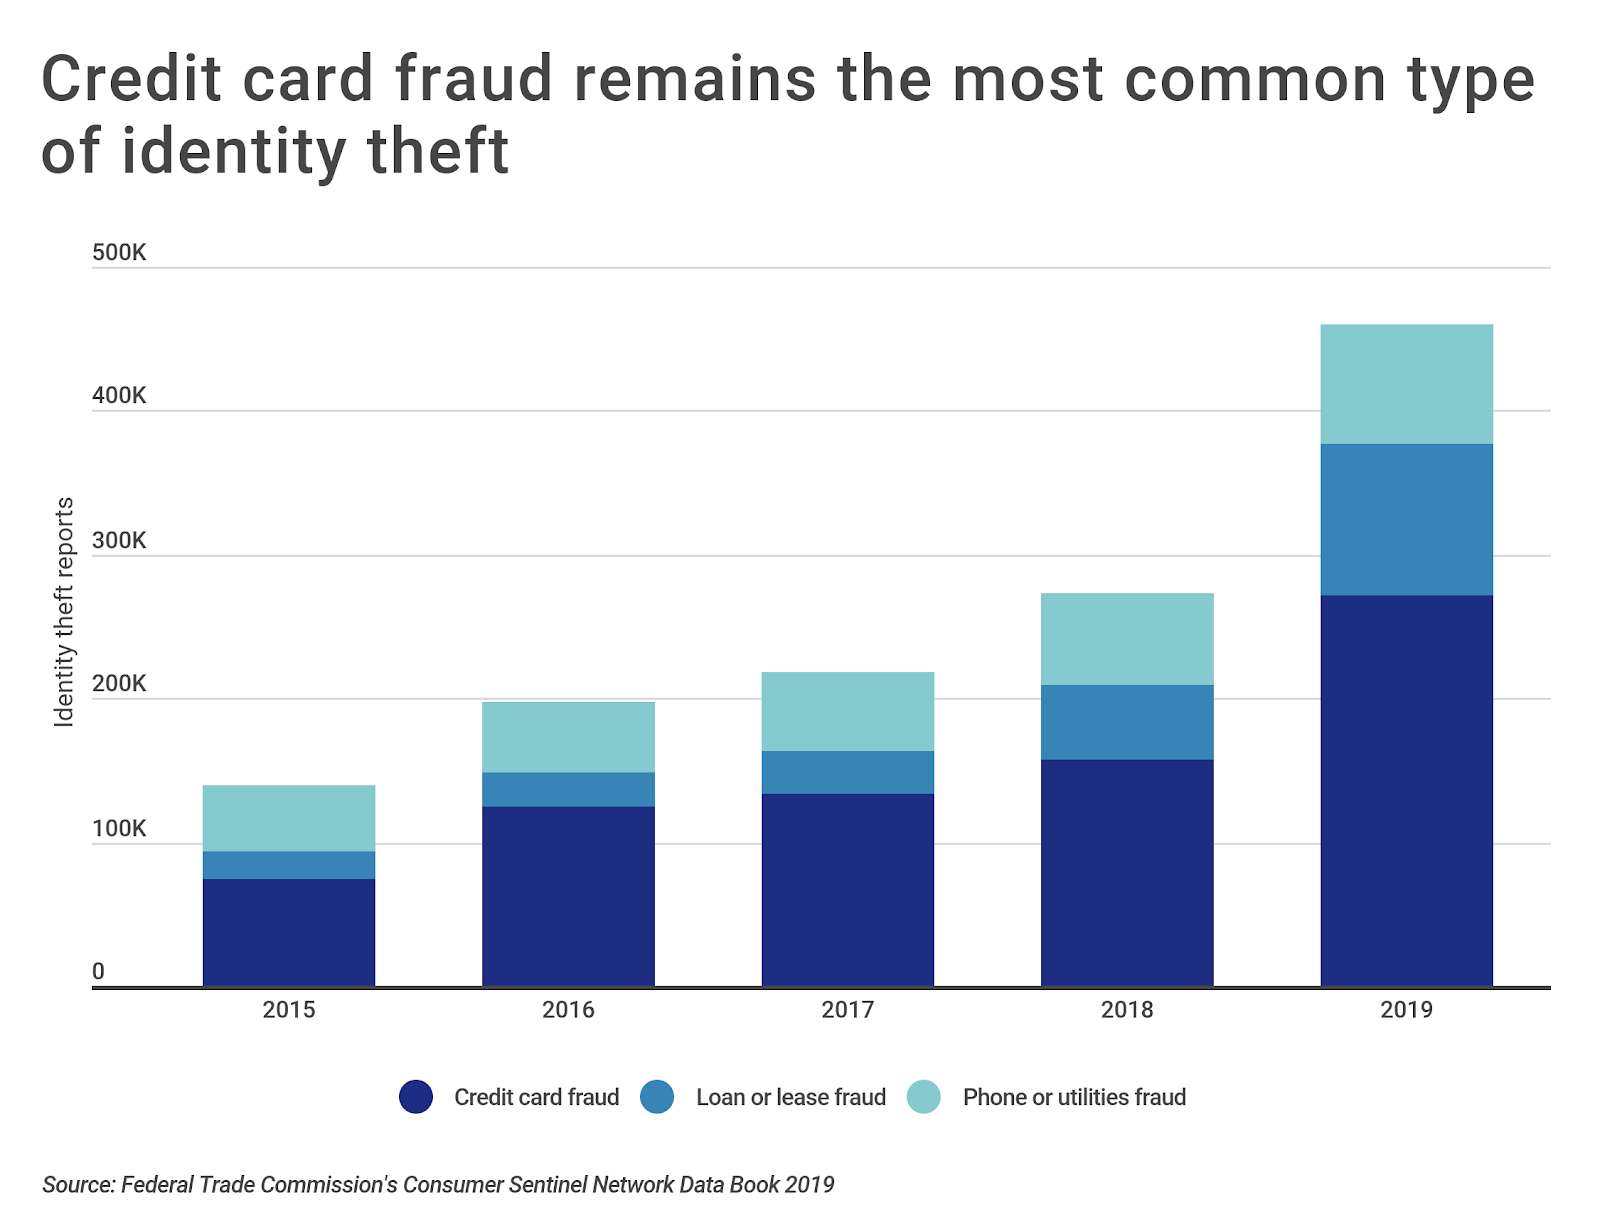
The FTC classifies identity theft incidents into several different categories: credit card fraud, loan or lease fraud, phone or utilities fraud, bank fraud, employment or tax-related fraud, government documents or benefits fraud, and other identity theft. In 2019 the three most common types of identity theft were credit card fraud, loan or lease fraud, and phone or utilities fraud. Notably, there were 271,823 reports of credit card fraud in 2019, an increase of over 260 percent since 2015.
TRENDING ON CONSTRUCTION COVERAGE
Many people are surprised to learn that they should have a commercial vehicle insurance policy. We recommend Progressive’s business auto insurance in many cases.
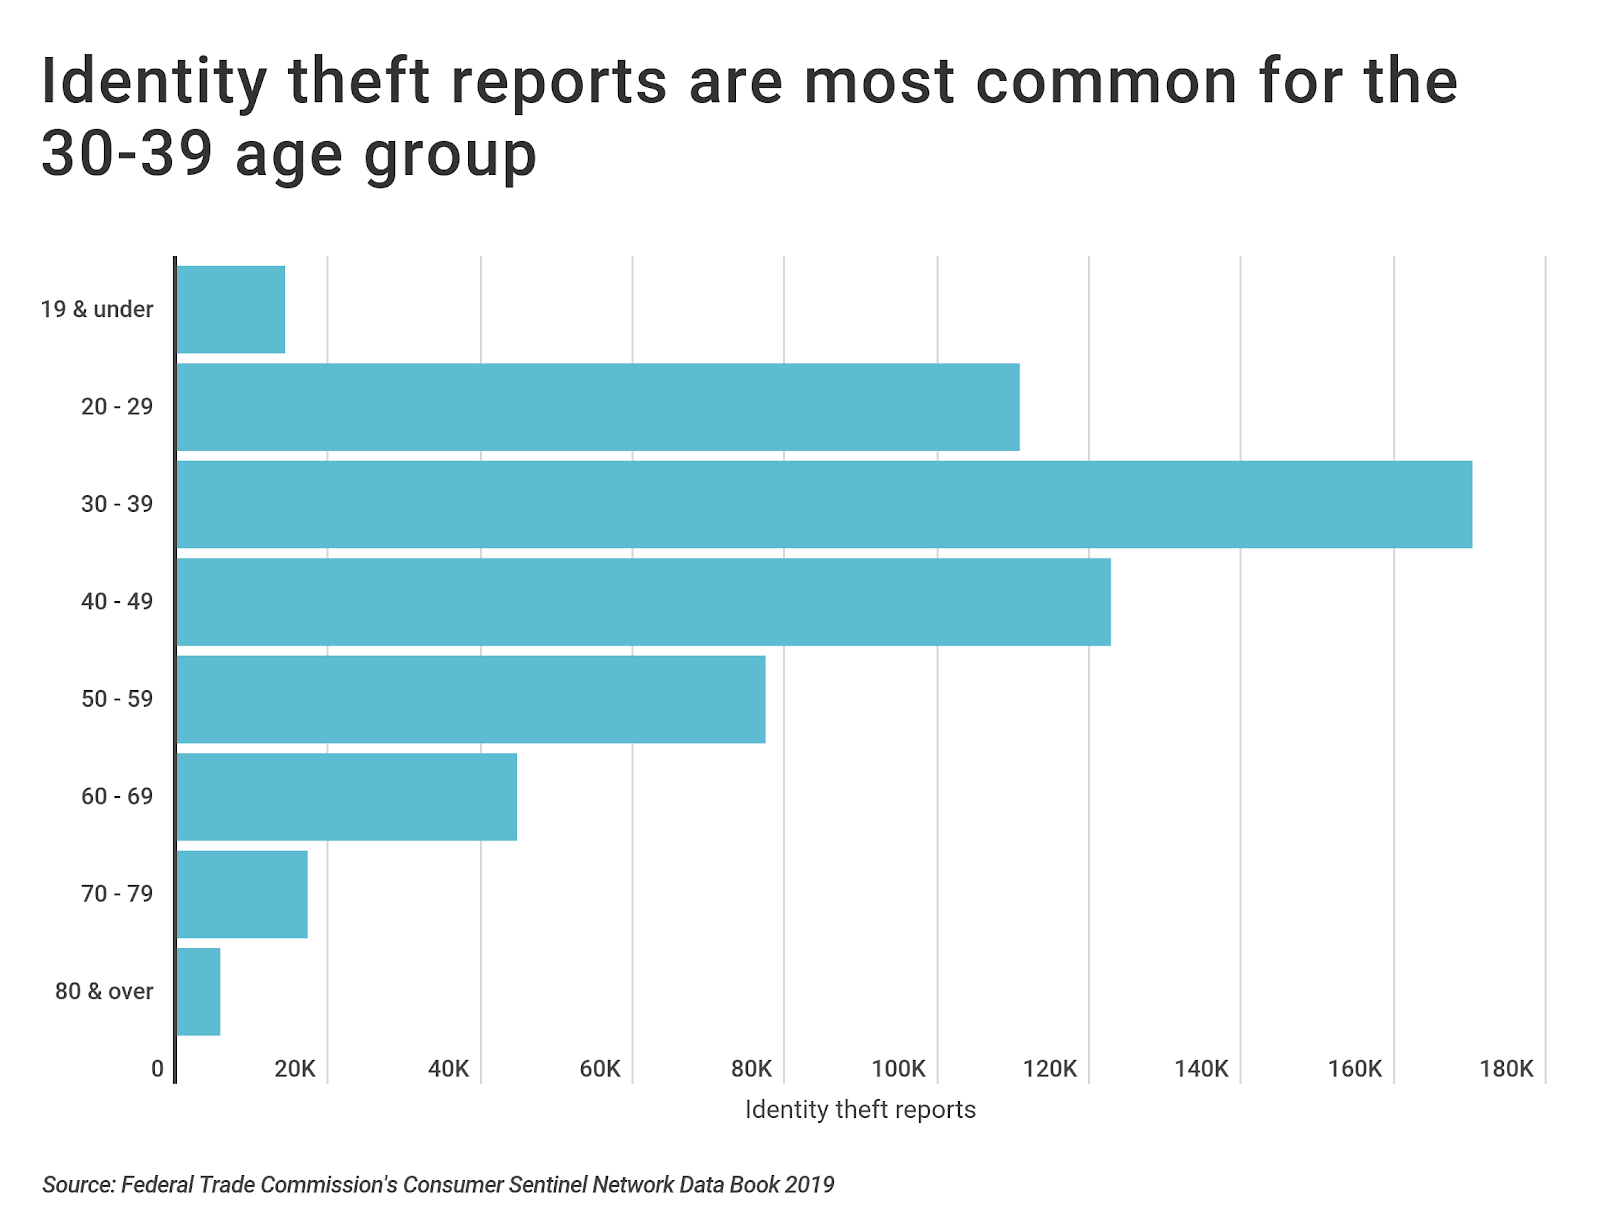
While Americans of all ages are at risk for identity theft, the FTC received the most identity theft reports for people aged 30-39. According to the ITRC, millennials are more willing to share their personal data online and less fearful of their information being compromised than other age groups—a combination that makes them especially vulnerable. While children and older adults are also high-risk, it is possible that many instances of identity theft for these groups go unreported or unnoticed.
To determine the U.S. states where you are most likely to get your identity stolen, researchers at Construction Coverage, a review site for business auto insurance and workers’ compensation insurance, analyzed the latest data from the FTC’s Consumer Sentinel Network 2019 Data Book. The researchers ranked states according to the number of identity theft reports per 100K population. Besides numbers of identity theft reports, researchers also calculated the change in identity theft reports from 2018 to 2019 and the most over-indexed type of identity theft—the category of identity theft that exceeded its respective national share by the greatest amount. Regardless of location, it’s important for residents to stay vigilant about scams that could result in identity theft, especially during a crisis like COVID-19.
Here are the top 15 states with the greatest number of identity theft reports per person.
15 States Where You Are Most Likely to Get Your Identity Stolen

15. Alabama
- Identity theft reports per 100K population: 173
- Total number of identity theft reports 2019: 8,454
- Year-over-year change in identity theft reports: 61.3%
- Most over-indexed form of identity theft: Loan or Lease Fraud

14. North Carolina
- Identity theft reports per 100K population: 179
- Total number of identity theft reports 2019: 18,584
- Year-over-year change in identity theft reports: 61.9%
- Most over-indexed form of identity theft: Loan or Lease Fraud
TRENDING
New software is changing how many construction professionals do business. Read through our updated guides that review everything you should know about: cost estimating software, takeoff software, and construction project management software.

13. Illinois
- Identity theft reports per 100K population: 182
- Total number of identity theft reports 2019: 23,139
- Year-over-year change in identity theft reports: 42.0%
- Most over-indexed form of identity theft: Credit Card Fraud

12. New York
- Identity theft reports per 100K population: 186
- Total number of identity theft reports 2019: 36,337
- Year-over-year change in identity theft reports: 49.9%
- Most over-indexed form of identity theft: Credit Card Fraud

11. New Jersey
- Identity theft reports per 100K population: 205
- Total number of identity theft reports 2019: 18,220
- Year-over-year change in identity theft reports: 61.6%
- Most over-indexed form of identity theft: Credit Card Fraud

10. Maryland
- Identity theft reports per 100K population: 210
- Total number of identity theft reports 2019: 12,675
- Year-over-year change in identity theft reports: 44.9%
- Most over-indexed form of identity theft: Credit Card Fraud

9. South Carolina
- Identity theft reports per 100K population: 213
- Total number of identity theft reports 2019: 10,851
- Year-over-year change in identity theft reports: 71.2%
- Most over-indexed form of identity theft: Loan or Lease Fraud

8. District of Columbia
- Identity theft reports per 100K population: 221
- Total number of identity theft reports 2019: 1,550
- Year-over-year change in identity theft reports: 34.1%
- Most over-indexed form of identity theft: Phone or Utilities Fraud

7. Delaware
- Identity theft reports per 100K population: 226
- Total number of identity theft reports 2019: 2,188
- Year-over-year change in identity theft reports: 44.2%
- Most over-indexed form of identity theft: Phone or Utilities Fraud

6. Louisiana
- Identity theft reports per 100K population: 227
- Total number of identity theft reports 2019: 10,582
- Year-over-year change in identity theft reports: 103.4%
- Most over-indexed form of identity theft: Loan or Lease Fraud
FOR CONSTRUCTION PROFESSIONALS
Just like builders risk insurance protects the property, workers’ compensation insurance protects the workers. Make sure to consider both before starting your next project.

5. Nevada
- Identity theft reports per 100K population: 256
- Total number of identity theft reports 2019: 7,757
- Year-over-year change in identity theft reports: 33.4%
- Most over-indexed form of identity theft: Credit Card Fraud

4. Texas
- Identity theft reports per 100K population: 256
- Total number of identity theft reports 2019: 73,553
- Year-over-year change in identity theft reports: 63.3%
- Most over-indexed form of identity theft: Loan or Lease Fraud

3. California
- Identity theft reports per 100K population: 257
- Total number of identity theft reports 2019: 101,639
- Year-over-year change in identity theft reports: 38.0%
- Most over-indexed form of identity theft: Credit Card Fraud

2. Florida
- Identity theft reports per 100K population: 304
- Total number of identity theft reports 2019: 64,842
- Year-over-year change in identity theft reports: 71.6%
- Most over-indexed form of identity theft: Credit Card Fraud

1. Georgia
- Identity theft reports per 100K population: 427
- Total number of identity theft reports 2019: 44,888
- Year-over-year change in identity theft reports: 88.0%
- Most over-indexed form of identity theft: Loan or Lease Fraud
Detailed Findings & Methodology
To find the states where you are most likely to get your identity stolen, Construction Coverage analyzed data from the Federal Trade Commission’s Consumer Sentinel Network 2019 Data Book. The FTC’s Consumer Sentinel Network is a secure online database that contains reports of consumers’ complaints in the marketplace. It includes reports on identity theft, fraud, and other consumer protection topics.
States were ranked according to the number of identity theft reports per 100,000 population for 2019. In the event of a tie, the state with the most identity theft reports overall was ranked higher. The year-over-year change in identity theft reports is the percentage difference in the number of identity theft reports from 2018 to 2019. In each state, the most over-indexed form of identity theft is the type that exceeded the national percentage by the greatest amount. Types of identity theft are credit card fraud, loan or lease fraud, phone or utilities fraud, bank fraud, employment or tax-related fraud, and government documents or benefits fraud.
The states where you are most likely to get your identity stolen are scattered throughout the country, from the South to the West Coast to the Northeast. Georgia leads the nation for identity theft reports per 100K population, with about 427 identity theft reports per 100,000 people and a total of almost 45,000 identity theft reports for 2019. All of the top 15 states experienced an increase in identity theft reports from 2018 to 2019, with an average percentage increase of about 58 percent. Credit card fraud and loan or lease fraud were the most common over-indexed forms of identity theft for states on the list.
With the advent of new scams related to the coronavirus, it’s essential to take precautions against identity theft. For internet safety, install security software on computers and avoid clicking email or text message links from unknown senders. In addition, don’t share any personal information with unsolicited vendors over the phone or online. To stay informed about ongoing coronavirus scams or to file a consumer complaint, visit the FTC website.