
The Best U.S. Cities to Find a Starter Home
Note: This is the most recent release of our Best U.S. Cities to Find a Starter Home study. To see data from prior years, please visit the Full Results section below.
The American dream of homeownership often begins with a starter home—a manageable property that allows young adults and families to establish roots, build equity, and lay the groundwork for financial security. This initial step on the property ladder fuels the housing market and strengthens the economy by creating a generation of invested homeowners. However, finding an affordable starter home has become increasingly challenging in recent times. With historically low levels of inventory at entry price points, homeownership in the U.S. has become an uphill battle.
Changes in Home Prices & Household Income Over Time
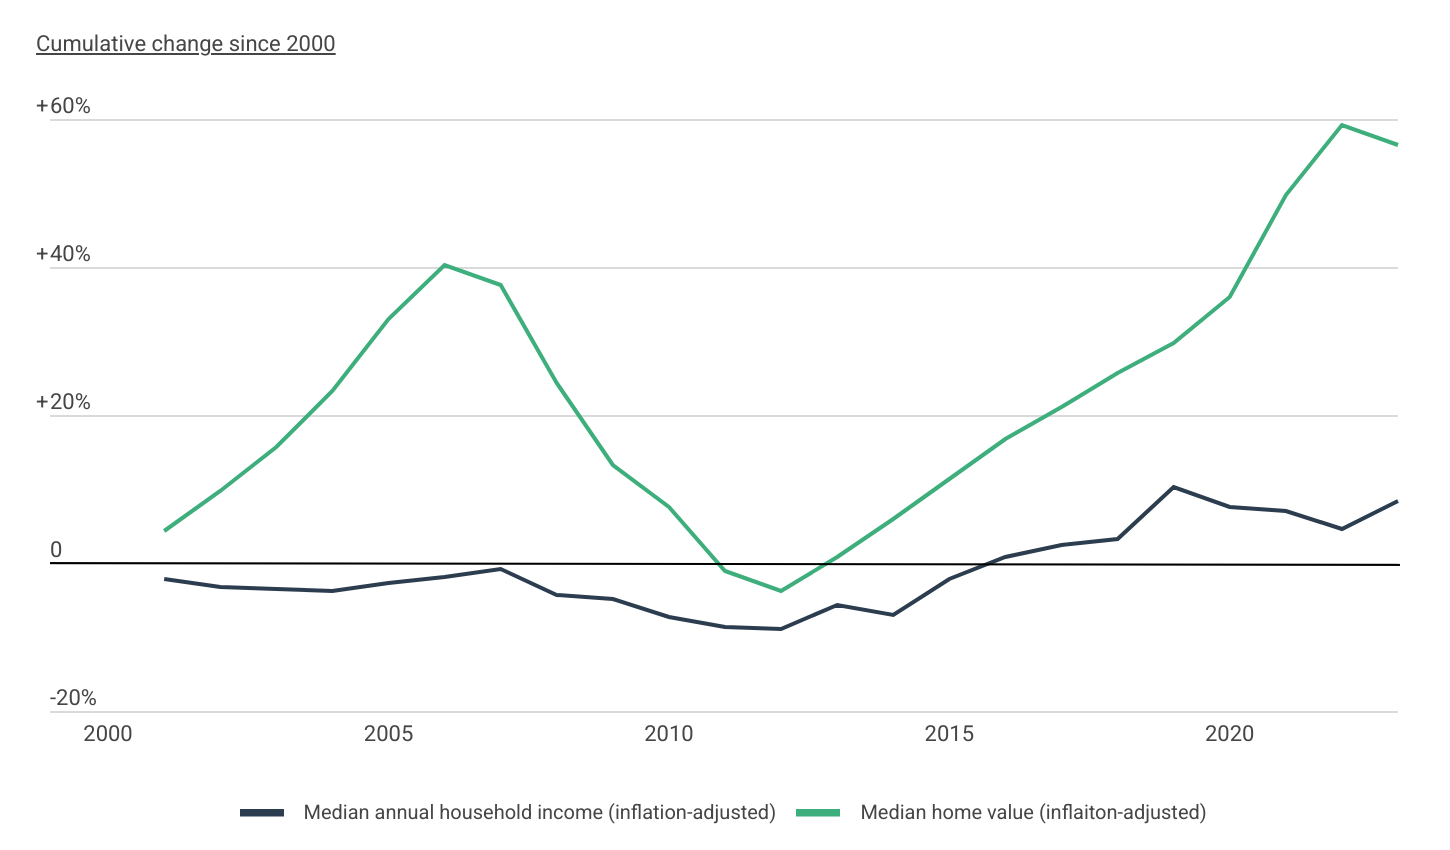
Changes in home prices have significantly outpaced income growth
Data: Changes in U.S. Home Prices and Household Income Over Time
| Year | Percentage change in income since 2000 | Percentage change in home value since 2000 |
|---|---|---|
| 2000 | N/A | N/A |
| 2001 | -2.2% | +4.3% |
| 2002 | -3.3% | +9.8% |
| 2003 | -3.5% | +15.6% |
| 2004 | -3.8% | +23.2% |
| 2005 | -2.7% | +33.1% |
| 2006 | -1.9% | +40.3% |
| 2007 | -0.7% | +37.7% |
| 2008 | -4.2% | +24.4% |
| 2009 | -4.9% | +13.3% |
| 2010 | -7.3% | +7.7% |
| 2011 | -8.7% | -1.1% |
| 2012 | -8.9% | -3.9% |
| 2013 | -5.7% | +0.8% |
| 2014 | -7.0% | +5.9% |
| 2015 | -2.2% | +11.4% |
| 2016 | +0.9% | +16.7% |
| 2017 | +2.3% | +21.1% |
| 2018 | +3.2% | +25.7% |
| 2019 | +10.2% | +29.7% |
| 2020 | +7.7% | +36.0% |
| 2021 | +7.1% | +49.6% |
| 2022 | +4.5% | +59.1% |
| 2023 | +8.5% | +56.5% |
Although recent market trends have presented significant challenges, the issue of housing affordability has persisted in the U.S. for decades. At the heart of the problem is the widening gap between rising home prices and comparatively stagnant household incomes. Between 2000 and 2023—the latest year with available data on median household income—median home prices surged by 56.5% after adjusting for inflation. In contrast, median household income increased by only 8.5% over the same period.
New Home Construction by Number of Bedrooms
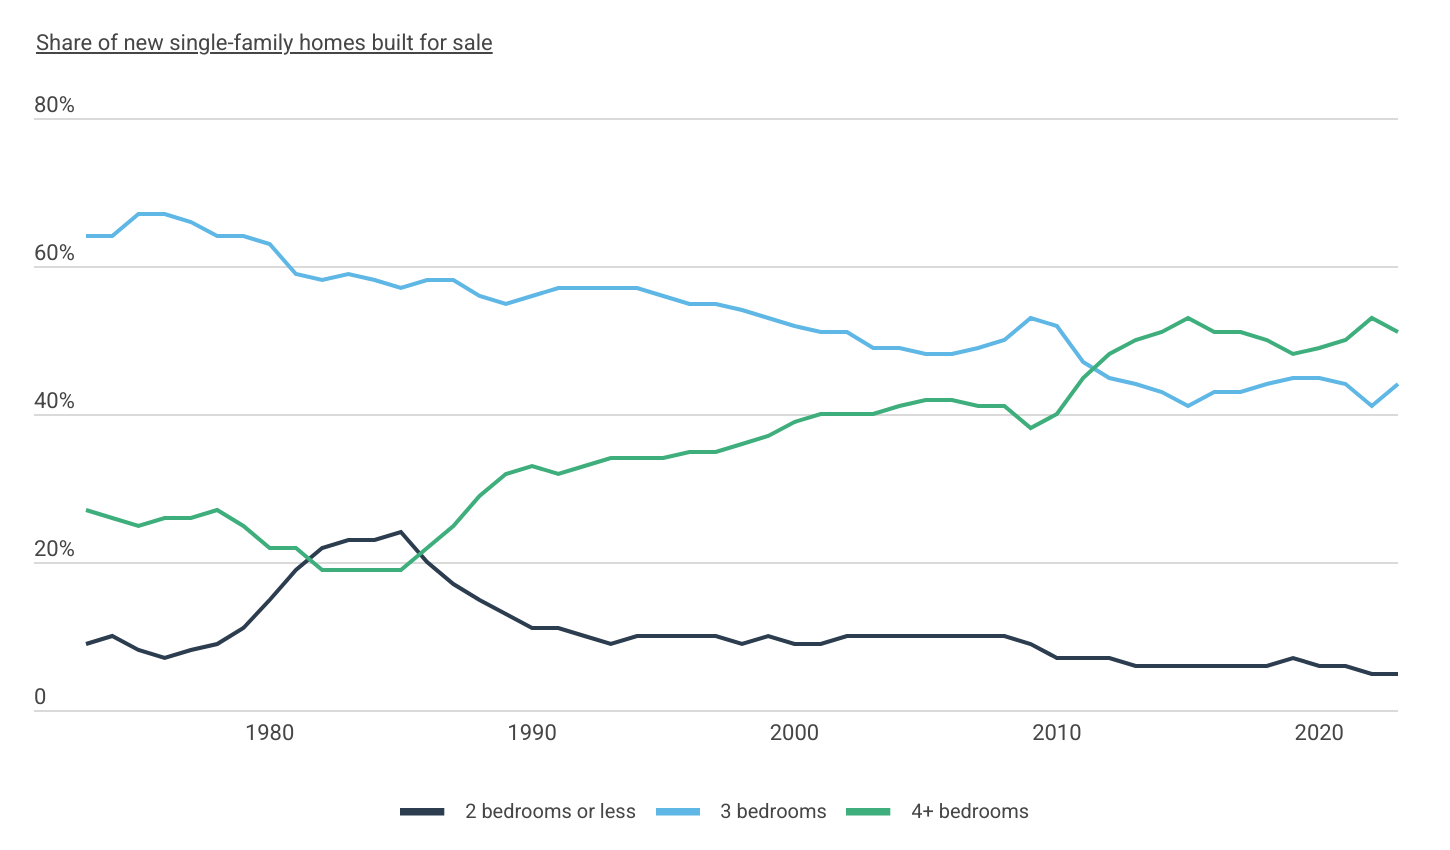
Smaller-sized, starter home construction has been on a multi-decade decline
Data: Share of New Single-Family Homes by Number of Bedrooms
| Year | 2 bedrooms or less | 3 bedrooms | 4+ bedrooms |
|---|---|---|---|
| 1973 | 9.0% | 64.0% | 27.0% |
| 1974 | 10.0% | 64.0% | 26.0% |
| 1975 | 8.0% | 67.0% | 25.0% |
| 1976 | 7.0% | 67.0% | 26.0% |
| 1977 | 8.0% | 66.0% | 26.0% |
| 1978 | 9.0% | 64.0% | 27.0% |
| 1979 | 11.0% | 64.0% | 25.0% |
| 1980 | 15.0% | 63.0% | 22.0% |
| 1981 | 19.0% | 59.0% | 22.0% |
| 1982 | 22.0% | 58.0% | 19.0% |
| 1983 | 23.0% | 59.0% | 19.0% |
| 1984 | 23.0% | 58.0% | 19.0% |
| 1985 | 24.0% | 57.0% | 19.0% |
| 1986 | 20.0% | 58.0% | 22.0% |
| 1987 | 17.0% | 58.0% | 25.0% |
| 1988 | 15.0% | 56.0% | 29.0% |
| 1989 | 13.0% | 55.0% | 32.0% |
| 1990 | 11.0% | 56.0% | 33.0% |
| 1991 | 11.0% | 57.0% | 32.0% |
| 1992 | 10.0% | 57.0% | 33.0% |
| 1993 | 9.0% | 57.0% | 34.0% |
| 1994 | 10.0% | 57.0% | 34.0% |
| 1995 | 10.0% | 56.0% | 34.0% |
| 1996 | 10.0% | 55.0% | 35.0% |
| 1997 | 10.0% | 55.0% | 35.0% |
| 1998 | 9.0% | 54.0% | 36.0% |
| 1999 | 10.0% | 53.0% | 37.0% |
| 2000 | 9.0% | 52.0% | 39.0% |
| 2001 | 9.0% | 51.0% | 40.0% |
| 2002 | 10.0% | 51.0% | 40.0% |
| 2003 | 10.0% | 49.0% | 40.0% |
| 2004 | 10.0% | 49.0% | 41.0% |
| 2005 | 10.0% | 48.0% | 42.0% |
| 2006 | 10.0% | 48.0% | 42.0% |
| 2007 | 10.0% | 49.0% | 41.0% |
| 2008 | 10.0% | 50.0% | 41.0% |
| 2009 | 9.0% | 53.0% | 38.0% |
| 2010 | 7.0% | 52.0% | 40.0% |
| 2011 | 7.0% | 47.0% | 45.0% |
| 2012 | 7.0% | 45.0% | 48.0% |
| 2013 | 6.0% | 44.0% | 50.0% |
| 2014 | 6.0% | 43.0% | 51.0% |
| 2015 | 6.0% | 41.0% | 53.0% |
| 2016 | 6.0% | 43.0% | 51.0% |
| 2017 | 6.0% | 43.0% | 51.0% |
| 2018 | 6.0% | 44.0% | 50.0% |
| 2019 | 7.0% | 45.0% | 48.0% |
| 2020 | 6.0% | 45.0% | 49.0% |
| 2021 | 6.0% | 44.0% | 50.0% |
| 2022 | 5.0% | 41.0% | 53.0% |
| 2023 | 5.0% | 44.0% | 51.0% |
Planning to build or renovate your first home?
Whether you’re a homeowner starting new construction or a small contractor working on a client’s starter home, builders risk insurance can protect your investment during the build. Learn more in this builders risk insurance guide.
Supply has been another constraint for first-time homebuyers. The U.S. faces a shortage of housing overall, but builders are also building fewer of the smaller, more affordable homes they used to. One- or two-bedroom homes represented 24% of single-family homes built in the mid-1980s, but just 5% in 2023—the lowest level on record. Over the same span, the share of new homes with four or more bedrooms grew from 19% to 51%.
Regional Differences in the Availability of Starter Homes
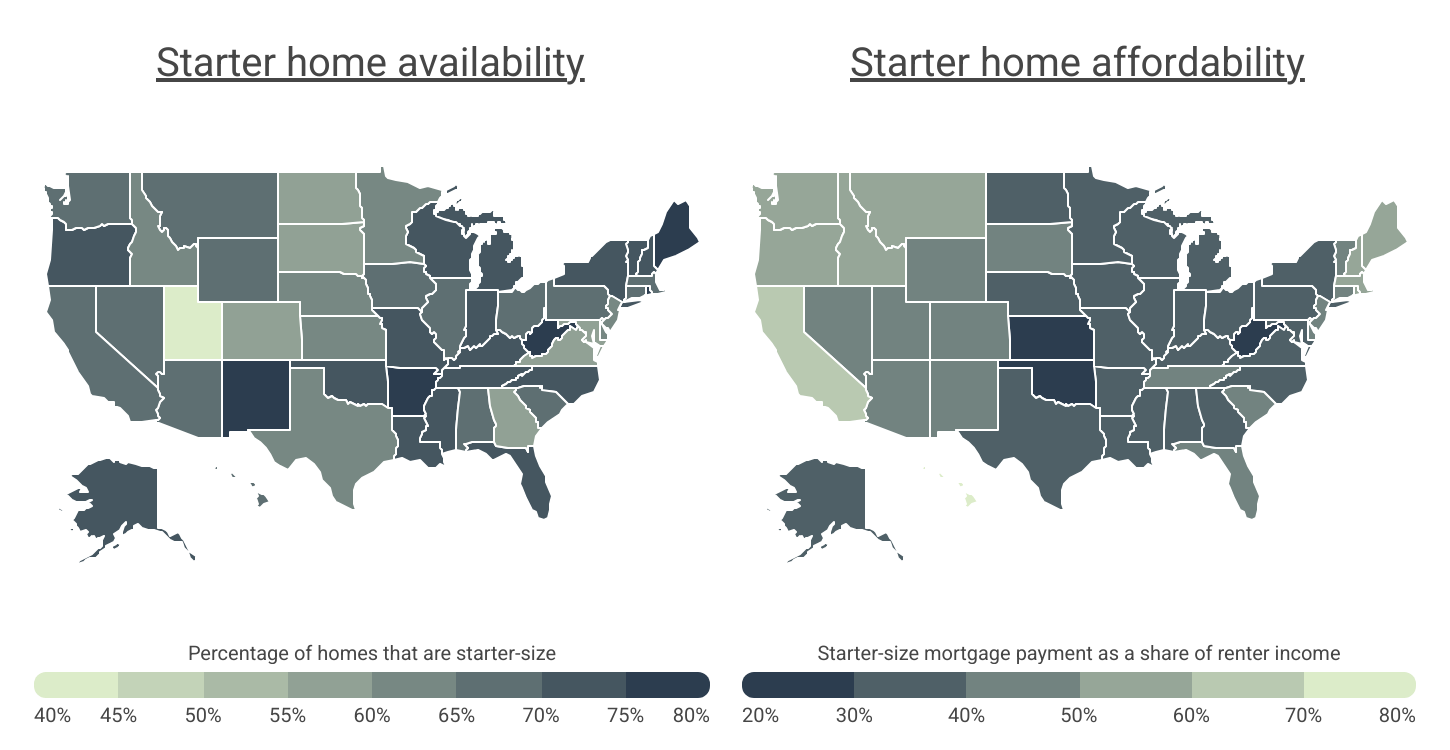
Starter-size homes are more common and more affordable in the eastern half of the U.S.
Data: Share of Homes That Are Starter-Size & Starter-Size Mortgage Payment as a Share of Renter Income (by State)
| State | Starter-size share |
|---|---|
| Hawaii | 69.7% |
| California | 65.1% |
| Massachusetts | 68.5% |
| Montana | 66.0% |
| Rhode Island | 75.7% |
| Oregon | 72.9% |
| New Hampshire | 73.9% |
| Washington | 66.7% |
| Maine | 76.8% |
| Idaho | 61.1% |
| Vermont | 74.8% |
| Colorado | 59.0% |
| New Jersey | 62.6% |
| New Mexico | 76.0% |
| Utah | 42.2% |
| Nevada | 65.7% |
| Connecticut | 69.0% |
| Arizona | 67.0% |
| Wyoming | 65.4% |
| Tennessee | 71.1% |
| Delaware | 64.6% |
| South Dakota | 58.7% |
| Florida | 74.1% |
| South Carolina | 68.9% |
| Wisconsin | 71.3% |
| New York | 70.4% |
| North Carolina | 70.4% |
| Minnesota | 60.9% |
| Maryland | 56.8% |
| Kentucky | 72.8% |
| Louisiana | 73.0% |
| Georgia | 59.0% |
| Arkansas | 75.9% |
| Alabama | 69.3% |
| Michigan | 71.7% |
| Alaska | 71.8% |
| Virginia | 59.7% |
| Pennsylvania | 69.5% |
| Mississippi | 73.6% |
| Missouri | 70.4% |
| Nebraska | 62.5% |
| Indiana | 71.8% |
| North Dakota | 57.6% |
| Illinois | 69.4% |
| Ohio | 69.3% |
| Texas | 63.3% |
| Iowa | 66.7% |
| West Virginia | 75.5% |
| Oklahoma | 73.0% |
| Kansas | 61.6% |
| State | Mortgage payment share |
|---|---|
| Hawaii | 73.2% |
| California | 64.0% |
| Massachusetts | 59.7% |
| Montana | 57.1% |
| Rhode Island | 54.1% |
| Oregon | 52.7% |
| New Hampshire | 52.4% |
| Washington | 52.0% |
| Maine | 51.8% |
| Idaho | 51.4% |
| Vermont | 49.3% |
| Colorado | 47.9% |
| New Jersey | 47.4% |
| New Mexico | 46.5% |
| Utah | 46.1% |
| Nevada | 44.6% |
| Connecticut | 44.2% |
| Arizona | 42.8% |
| Wyoming | 42.3% |
| Tennessee | 40.6% |
| Delaware | 40.6% |
| South Dakota | 40.6% |
| Florida | 40.0% |
| South Carolina | 40.0% |
| Wisconsin | 38.7% |
| New York | 38.3% |
| North Carolina | 38.2% |
| Minnesota | 37.5% |
| Maryland | 37.4% |
| Kentucky | 36.7% |
| Louisiana | 36.2% |
| Georgia | 36.0% |
| Arkansas | 35.6% |
| Alabama | 35.6% |
| Michigan | 35.4% |
| Alaska | 35.0% |
| Virginia | 34.4% |
| Pennsylvania | 33.4% |
| Mississippi | 33.3% |
| Missouri | 32.6% |
| Nebraska | 32.4% |
| Indiana | 32.2% |
| North Dakota | 32.0% |
| Illinois | 31.5% |
| Ohio | 31.0% |
| Texas | 30.5% |
| Iowa | 30.0% |
| West Virginia | 29.0% |
| Oklahoma | 28.2% |
| Kansas | 26.0% |
The declining trend in the construction of starter-size homes—defined here as homes with three or fewer bedrooms—is especially apparent in the northern areas of the Great Plains and Mountain West. Less densely populated than their Northeast or West Coast counterparts, states in these regions all have a below-average share of starter-size homes (compared to the national average of 67.5%). Notably, Utah (42.2%) stands out with the lowest proportion of homes with three or fewer bedrooms, while Maine (76.8%) and New Mexico (76.0%) offer the greatest proportion of smaller homes.
Another important factor for new homebuyers is affordability. Nationally, the monthly mortgage payment for a typical starter-size home would consume 38.4% of the median income for renter households. In recent years, many of the most challenging real estate markets for first-time buyers have been concentrated in the western states, spanning the Mountain West, Pacific Coast, and Hawaii, all of which exhibit above-average mortgage costs relative to income.
Working on smaller-scale residential projects?
From general liability to tools and equipment coverage, construction insurance helps protect your business from jobsite risks, unexpected delays, and property damage. Explore your options in this guide to construction insurance.
Hawaii is the least affordable state for potential first-time buyers, with mortgage payments devouring 73.2% of the median income for renters. Hawaii is closely followed by California at 64.0%, making these states some of the worst for those seeking starter homes. At the opposite end of the spectrum, states in the Midwest and South, like Kansas (26.0%), Oklahoma (28.2%), and West Virginia (29.0%), provide buying opportunities that account for a much smaller share of income.
While conditions are challenging overall for new buyers, some parts of the U.S. are more favorable than others. To determine the best places to find a starter home in the U.S., researchers at Construction Coverage calculated a composite score based on the percentage of homes with three or fewer bedrooms (40% of the score), the monthly starter-size home mortgage payment as a percentage of median renter income (20%), median sale price of homes with three or fewer bedrooms (15%), supply of homes (15%), and the homeownership rate for under-35 householders (10%).
By these measures, West Virginia is the best state in the country to find a starter home, followed by Mississippi and Oklahoma. Starter-size homes in these states represent over 70% of the total housing stock and are relatively affordable. Similar trends hold at the metropolitan level, with Southern and Rust Belt cities leading the way.
Managing tight budgets on starter home builds?
Construction accounting software helps contractors and small builders stay on top of job costs, profitability, and cash flow—critical in low-margin markets. Compare solutions in our construction accounting software guide.
Below is a complete breakdown of more than 330 metros and all 50 states. For more information on data sources and calculations, see the methodology section.
Best Cities to Find a Starter Home
| Top Large Metros | Score* |
|---|---|
| 1. Pittsburgh, PA | 71.8 |
| 2. Birmingham-Hoover, AL | 59.2 |
| 3. Detroit-Warren-Dearborn, MI | 58.9 |
| 4. Tulsa, OK | 58.7 |
| 5. Oklahoma City, OK | 57.3 |
| 6. Tampa-St. Petersburg-Clearwater, FL | 56.1 |
| 7. Miami-Fort Lauderdale-Pompano Beach, FL | 55.6 |
| 8. San Antonio-New Braunfels, TX | 53.8 |
| 9. St. Louis, MO-IL | 52.3 |
| 10. Louisville-Jefferson County, KY-IN | 50.5 |
| 11. Cleveland, OH | 49.2 |
| 12. Rochester, NY | 48.8 |
| 13. Memphis, TN-MS-AR | 48.7 |
| 14. Buffalo-Cheektowaga, NY | 48.5 |
| 15. Jacksonville, FL | 47.3 |
| Bottom Large Metros | Score* |
|---|---|
| 1. San Jose-Sunnyvale-Santa Clara, CA | 3.4 |
| 2. Seattle-Tacoma-Bellevue, WA | 13.0 |
| 3. San Diego-Chula Vista-Carlsbad, CA | 13.4 |
| 4. San Francisco-Oakland-Berkeley, CA | 14.8 |
| 5. Denver-Aurora-Lakewood, CO | 16.0 |
| 6. Salt Lake City, UT | 18.2 |
| 7. Sacramento-Roseville-Folsom, CA | 18.5 |
| 8. Washington-Arlington-Alexandria, DC-VA-MD-WV | 18.8 |
| 9. Riverside-San Bernardino-Ontario, CA | 20.5 |
| 10. Los Angeles-Long Beach-Anaheim, CA | 21.2 |
| 11. Boston-Cambridge-Newton, MA-NH | 23.4 |
| 12. Portland-Vancouver-Hillsboro, OR-WA | 25.2 |
| 13. Richmond, VA | 25.6 |
| 14. Fresno, CA | 27.0 |
| 15. Las Vegas-Henderson-Paradise, NV | 27.1 |
| Top Midsize Metros | Score* |
|---|---|
| 1. Beaumont-Port Arthur, TX | 85.5 |
| 2. Ocala, FL | 82.4 |
| 3. Youngstown-Warren-Boardman, OH-PA | 81.8 |
| 4. Hickory-Lenoir-Morganton, NC | 77.9 |
| 5. Brownsville-Harlingen, TX | 76.8 |
| 6. McAllen-Edinburg-Mission, TX | 76.4 |
| 7. Gulfport-Biloxi, MS | 76.2 |
| 8. Shreveport-Bossier City, LA | 74.1 |
| 9. Flint, MI | 73.8 |
| 10. Lafayette, LA | 72.8 |
| 11. Lubbock, TX | 72.4 |
| 12. Cape Coral-Fort Myers, FL | 72.2 |
| 13. Deltona-Daytona Beach-Ormond Beach, FL | 72.2 |
| 14. Canton-Massillon, OH | 71.8 |
| 15. Huntington-Ashland, WV-KY-OH | 71.8 |
| Bottom Midsize Metros | Score* |
|---|---|
| 1. Oxnard-Thousand Oaks-Ventura, CA | 10.2 |
| 2. Bridgeport-Stamford-Norwalk, CT | 14.2 |
| 3. Vallejo, CA | 17.2 |
| 4. Spokane-Spokane Valley, WA | 19.3 |
| 5. Fort Collins, CO | 19.4 |
| 6. Greeley, CO | 23.0 |
| 7. Trenton-Princeton, NJ | 23.0 |
| 8. Boise City, ID | 23.0 |
| 9. Madison, WI | 23.3 |
| 10. Provo-Orem, UT | 23.7 |
| 11. Modesto, CA | 24.1 |
| 12. Stockton, CA | 24.2 |
| 13. Santa Maria-Santa Barbara, CA | 24.7 |
| 14. Ann Arbor, MI | 27.0 |
| 15. Salinas, CA | 27.0 |
| Top Small Metros | Score* |
|---|---|
| 1. Wheeling, WV-OH | 94.4 |
| 2. Terre Haute, IN | 92.9 |
| 3. Weirton-Steubenville, WV-OH | 92.7 |
| 4. Victoria, TX | 91.7 |
| 5. Wichita Falls, TX | 89.8 |
| 6. Beckley, WV | 88.0 |
| 7. Longview, TX | 84.6 |
| 8. Parkersburg-Vienna, WV | 83.4 |
| 9. Fort Smith, AR-OK | 82.5 |
| 10. Anniston-Oxford, AL | 82.5 |
| 11. Rocky Mount, NC | 82.2 |
| 12. Saginaw, MI | 82.1 |
| 13. Lake Charles, LA | 81.8 |
| 14. Punta Gorda, FL | 80.4 |
| 15. Albany, GA | 80.0 |
| Bottom Small Metros | Score* |
|---|---|
| 1. Boulder, CO | 14.3 |
| 2. Charlottesville, VA | 16.2 |
| 3. Merced, CA | 18.5 |
| 4. Corvallis, OR | 20.1 |
| 5. State College, PA | 20.3 |
| 6. Auburn-Opelika, AL | 21.8 |
| 7. Idaho Falls, ID | 22.1 |
| 8. Pocatello, ID | 24.0 |
| 9. Logan, UT-ID | 25.7 |
| 10. St. George, UT | 25.9 |
| 11. St. Cloud, MN | 26.3 |
| 12. Walla Walla, WA | 26.4 |
| 13. Missoula, MT | 26.8 |
| 14. Lincoln, NE | 27.8 |
| 15. Billings, MT | 28.0 |
Best States to Find a Starter Home
| Top States | Score* |
|---|---|
| 1. West Virginia | 87.4 |
| 2. Mississippi | 85.9 |
| 3. Oklahoma | 78.8 |
| 4. Arkansas | 76.8 |
| 5. Louisiana | 76.6 |
| 6. New Mexico | 71.7 |
| 7. Kentucky | 68.1 |
| 8. Indiana | 67.8 |
| 9. Maine | 67.0 |
| 10. Florida | 66.1 |
| 11. Michigan | 64.6 |
| 12. Iowa | 63.8 |
| 13. Alabama | 63.6 |
| 14. Vermont | 63.0 |
| 15. Ohio | 61.4 |
| Bottom States | Score* |
|---|---|
| 1. California | 17.3 |
| 2. Washington | 20.5 |
| 3. Colorado | 22.0 |
| 4. Massachusetts | 22.2 |
| 5. New Jersey | 23.6 |
| 6. Maryland | 25.8 |
| 7. Idaho | 26.0 |
| 8. Utah | 26.1 |
| 9. Virginia | 31.6 |
| 10. Nevada | 31.6 |
| 11. Connecticut | 34.9 |
| 12. Minnesota | 35.8 |
| 13. Delaware | 35.9 |
| 14. Montana | 36.3 |
| 15. Hawaii | 38.3 |
*Composite score
Full Results
Methodology
To determine the best locations to find a starter home in the U.S., researchers at Construction Coverage analyzed the latest data from the U.S. Census Bureau’s 2023 American Community Survey, Zillow’s Housing Data, Redfin’s Data Center, and Freddie Mac’s Primary Mortgage Market Survey. The researchers ranked locations according to a composite score comprising the following factors and weights:
- Percentage of owner-occupied homes with three or fewer bedrooms (40%)
- Monthly mortgage payment for homes with three or fewer bedrooms as a percentage of median renter income (20%)
- Median sale price of homes with three or fewer bedrooms (15%)
- Months supply (15%)
- Homeownership rate for under-35 householders (10%)
The monthly mortgage payment as a percentage of income was calculated using a 20% down payment for the median home sale price for three or fewer bedroom homes, a 6.76% interest rate, and the median monthly renter-occupied household income. Median home sales prices and months supply data were from March 2024, the latest data available.
In the event of a tie, the location with the larger percentage of homes with three or fewer bedrooms was ranked higher. To improve relevance, only metropolitan areas with complete data were included, and metros were grouped into cohorts based on population size: small (less than 350,000), midsize (350,000–999,999), and large (1,000,000 or more).
References
- Lane, S. (April 17, 2025). America’s Housing Shortage By The Numbers. The Hill. https://thehill.com/business/5252769-americas-housing-shortage-by-the-numbers/.
- U.S. Census Bureau (2025). American Community Survey (ACS). https://www.census.gov/programs-surveys/acs.
- Zillow (2025). Housing Data. https://www.zillow.com/research/data/.
- Redfin (2025). Data Center. https://www.redfin.com/news/data-center/.
- Freddie Mac (May 8, 2025). Mortgage Rates. https://www.freddiemac.com/pmms.