
The Top Reasons Mortgage Loans Are Denied in the U.S. [2021 Edition]
Although interest rates have inched up recently, they remain at historic lows, spurring demand in both home purchases and mortgage refinancing. However, many lenders have tightened up their borrowing standards due to the economic uncertainty of the pandemic, and hopeful loan applicants may find it hard to get approved. According to loan-level mortgage data from the Home Mortgage Disclosure Act, the denial rate for conventional, single-family loans was 18.8% (excluding withdrawn and incomplete applications) in 2019.
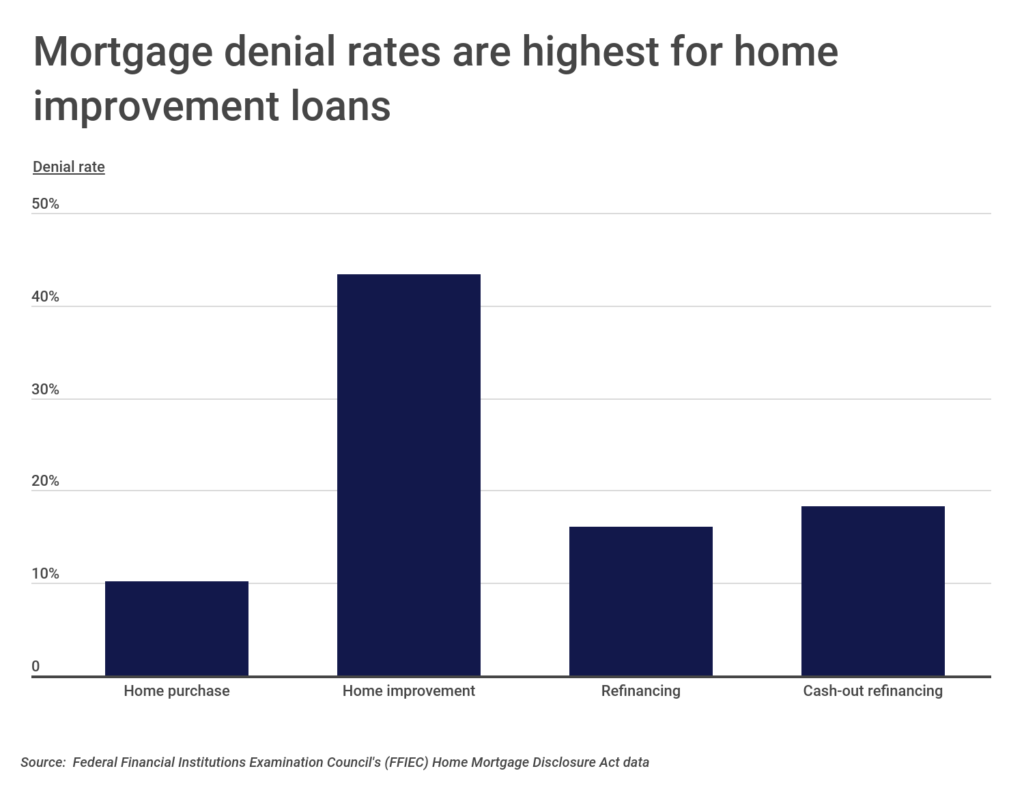
Mortgage application denial rates vary by purpose of the loan. When considering total loan applications for conventional, single-family loans, 2,055,774 applications were denied. At 43%, denial rates were highest for home improvement loans. Loans for home purchases had the lowest denial rate, at just 10%. Refinancing applications, both with and without a cash-out component, had denial rates in between, at 16% for non-cash-out and 18% for cash-out refinance loans.
RELATED
Do you operate a business out of your home? If so, speak with a commercial property insurance company to learn about what your homeowners policy might not cover.
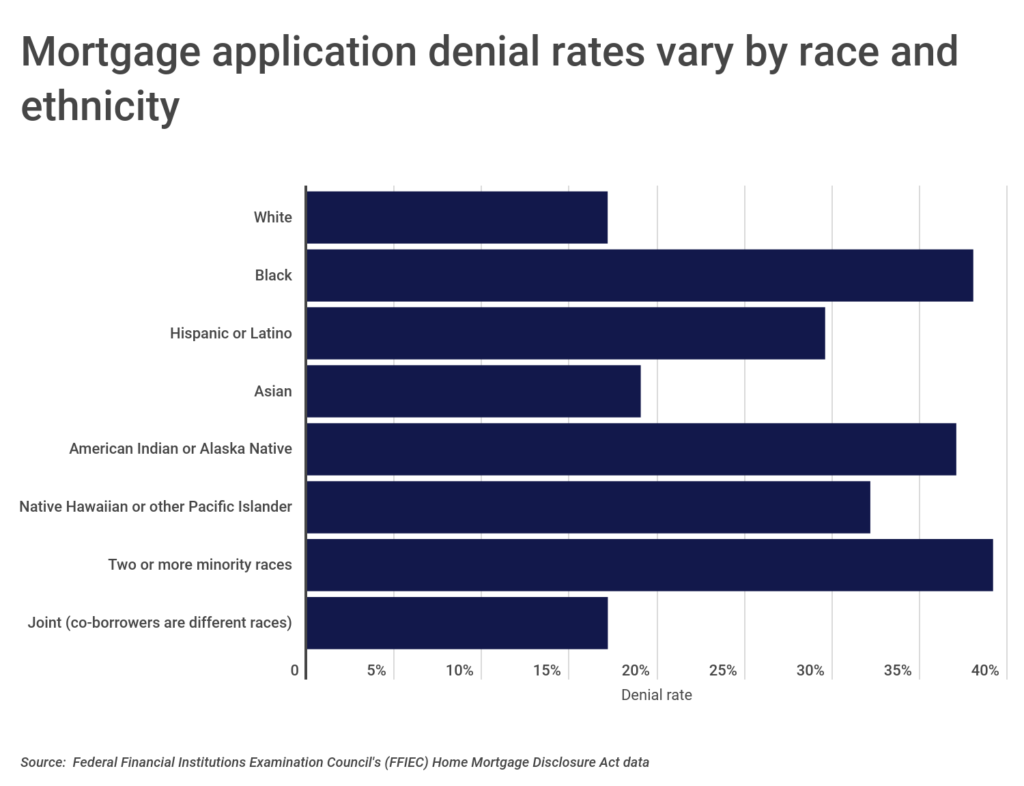
Mortgage application denial rates vary not only by purpose of the loan but also by the race and ethnicity of the applicant. Non-Hispanic White applicants and co-applicants of different races (“Joint”) had the lowest denial rates at 17%. Black, American Indian or Alaskan Native, and applicants of two or more minority races all had a denial rate that was more than twice as high as that for White applicants. Hispanic or Latino borrowers also had high denial rates, at nearly 30%. The difference in denial rates reflects differences in credit profiles and application types across different demographic groups, but it also may reflect racial and ethnic discrimination in lending behavior.
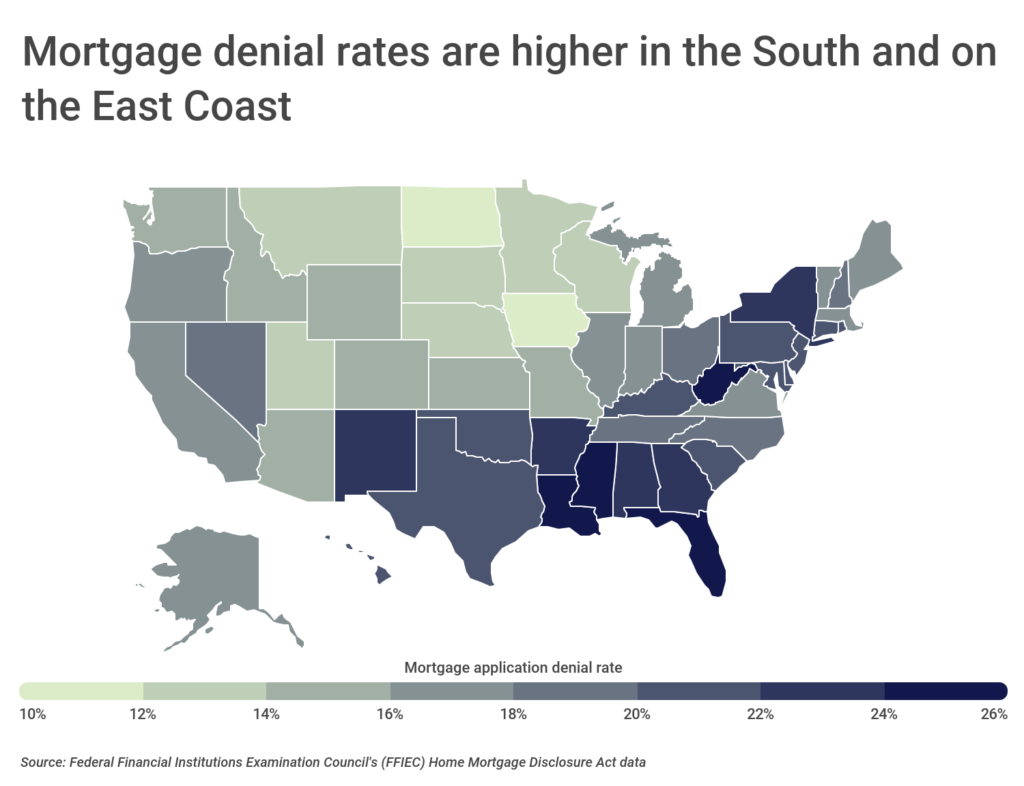
Loan approvals and denials also vary widely by location. Denial rates skew higher in the South, Southeast, and parts of the Northeast, while denial rates are much lower in the Midwest. This could be due to varying demographic makeups and local job market conditions. At the state level, Mississippi and Florida have the highest mortgage denial rates in the U.S. at 27.3% and 25%, respectively. At the opposite end of the spectrum, North Dakota has the lowest mortgage denial rate in the country, at just 10.2%.
To find the top reasons mortgage loans are denied, researchers at Construction Coverage analyzed the latest data from the Home Mortgage Disclosure Act. The researchers ranked reasons mortgage loans are denied based on the percentage of all denials mentioning each reason. For each reason that mortgage loans are denied, researchers also calculated the total annual denials and the percentage of denials that were due to that reason for several loan types: home purchase, refinancing, cash-out refinancing, and home improvement.
The Top Reasons Mortgage Loans Are Denied

Photo Credit: Alamy Stock Photo
1. Debt-to-income ratio
- Percentage of all denials: 37.2%
- Total annual denials: 765,772
- Percentage of home purchase denials: 36.2%
- Percentage of refinancing denials: 38.0%
- Percentage of cash-out refinancing denials: 35.4%
- Percentage of home improvement denials: 37.2%
The debt-to-income ratio (DTI) ratio is the share of gross monthly income (pre-tax) that goes towards debt payments (rent or mortgage, car payment, credit cards, student loans, etc.). A lower DTI can help applicants get approved for a mortgage.

Photo Credit: Alamy Stock Photo
2. Credit history
- Percentage of all denials: 34.8%
- Total annual denials: 715,393
- Percentage of home purchase denials: 34.2%
- Percentage of refinancing denials: 24.8%
- Percentage of cash-out refinancing denials: 25.8%
- Percentage of home improvement denials: 44.8%
A mortgage applicant’s credit history gives lenders an idea of how risky it is to loan an applicant money. Credit history is a record of how an individual repays debts, such as credit cards, mortgages, car loans, and other bills.

Photo Credit: Alamy Stock Photo
3. Collateral
- Percentage of all denials: 19.7%
- Total annual denials: 404,084
- Percentage of home purchase denials: 13.9%
- Percentage of refinancing denials: 18.5%
- Percentage of cash-out refinancing denials: 19.6%
- Percentage of home improvement denials: 23.4%
Insufficient collateral means that the home an applicant is trying to purchase, refinance, or borrow against is not worth enough compared to the proposed loan amount.

Photo Credit: Alamy Stock Photo
4. Other
- Percentage of all denials: 12.9%
- Total annual denials: 265,772
- Percentage of home purchase denials: 13.2%
- Percentage of refinancing denials: 12.9%
- Percentage of cash-out refinancing denials: 15.0%
- Percentage of home improvement denials: 12.0%
The “Other” category covers all other reasons that an applicant could be denied a home loan besides the eight covered by the Home Mortgage Disclosure Act and listed here.

Photo Credit: Alamy Stock Photo
5. Credit application incomplete
- Percentage of all denials: 8.9%
- Total annual denials: 183,024
- Percentage of home purchase denials: 8.5%
- Percentage of refinancing denials: 14.4%
- Percentage of cash-out refinancing denials: 14.6%
- Percentage of home improvement denials: 4.1%
Incomplete credit applications lack the necessary information for the lender to make a credit decision, resulting in a loan denial.
Photo Credit: Alamy Stock Photo
6. Unverifiable information
- Percentage of all denials: 6.7%
- Total annual denials: 137,968
- Percentage of home purchase denials: 8.9%
- Percentage of refinancing denials: 5.8%
- Percentage of cash-out refinancing denials: 4.5%
- Percentage of home improvement denials: 6.4%
Mortgage denials due to unverifiable information often arise from inaccuracies in an applicant’s employment history or tax records or discrepancies between the application and credit report.

Photo Credit: Alamy Stock Photo
7. Insufficient cash (down payment, closing costs)
- Percentage of all denials: 4.0%
- Total annual denials: 82,354
- Percentage of home purchase denials: 8.6%
- Percentage of refinancing denials: 4.0%
- Percentage of cash-out refinancing denials: 4.4%
- Percentage of home improvement denials: 1.4%
Mortgage applicants must have sufficient funds to cover down payments and closing costs and fees, or lenders may deny their application.

Photo Credit: Alamy Stock Photo
8. Employment history
- Percentage of all denials: 1.8%
- Total annual denials: 37,567
- Percentage of home purchase denials: 3.9%
- Percentage of refinancing denials: 1.4%
- Percentage of cash-out refinancing denials: 1.6%
- Percentage of home improvement denials: 1.0%
Mortgage lenders prefer that applicants have worked in the same field for at least two years. However, a new job is not necessarily a hurdle to securing a loan as long as it pays a steady salary.

Photo Credit: Alamy Stock Photo
9. Mortgage insurance denied
- Percentage of all denials: 0.1%
- Total annual denials: 1,665
- Percentage of home purchase denials: 0.2%
- Percentage of refinancing denials: 0.1%
- Percentage of cash-out refinancing denials: 0.0%
- Percentage of home improvement denials: 0.0%
Mortgage insurance protects the lender and allows borrowers making a down payment of less than 20% to still qualify for a home loan. Applicants who are denied mortgage insurance that need it are also likely to be declined for their loan.
Detailed Findings & Methodology
A low debt-to-income ratio (DTI) is the number one reason that mortgage applications are denied. Over 37% of denied applications had a low DTI as a reason for denial. This rate is constant across home purchase loans, refinancing loans, and home improvement loans. The second most common reason for mortgage application denials is credit history, accounting for almost 35% of denials. Indeed, credit history was a reason that almost 45% of home improvement loans were denied. The third most common reason for mortgage application denials is collateral, which was cited in about one out of five mortgage denials. Together, these top three reasons account for the vast majority of mortgage denials.
Less common reasons for mortgage denials are an incomplete credit application, unverifiable information, insufficient cash, employment history, and mortgage insurance denied. While most applications list one denial reason, some applications list two or more.
To find the top reasons mortgage loans are denied, researchers at Construction Coverage analyzed the latest data from the Federal Financial Institutions Examination Council’s Home Mortgage Disclosure Act. The researchers ranked reasons mortgage loans are denied according to the percentage of all denials mentioning each reason. For each reason that mortgage loans are denied, researchers also calculated the total annual denials and the percentage of denials that were due to that reason for several loan types: home purchase, refinancing, cash-out refinancing, and home improvement.
Only conventional, single-family mortgage applications were considered in the analysis. In the calculation of denial rates, withdrawn and incomplete applications were excluded.